NFL Defensive Line Ratings Through Week 8

This week the goal is to try to find a way to rate NFL defensive lines using the Advance Defensive metrics from pro-football-reference.com. The plan is to use the Blitzing rate, QB Knockdowns, Hurries, Sacks, in a fomula that ranks defensive lines by the amount of pressure they bring without a blitz. Then we are going to take that rating and divide it by the Rush Yards/Attempt stat, meaning defensive lines that are better at stopping the run will have their adjusted pass rush score divided by a smaller number.
So let’s start with the theories, assumption and constants I used in order to generate the Defensive Line scores. The first part of the formula is quite simple as we will assign points for each QB Knockdown, Hurry, & Sack. The sum of these values will be known as Raw Pass Rush. The value for each is as follows:
- QB Knockdown = 1 point
- Hurry = 2 points
- Sack = 5 points
Here is the thinking behind those assigned values. QB knockdowns are not an indication of a hurry, simply that the QB was knocked down during the play. The QB could have had 10 seconds to throw, was never hurried, but still got knocked down. IF, the knockdown happened to occur exactly when the QB was releasing the football, it may have a dramatic effect on the result. Otherwise, the QB Knockdown didnt force the QB to hurry a throw, nor did it result in a loss of yardage and down like a sack.
Hurries are the next stage of pressure. A hurry indicates the QB was forced to alter the initial plan or at least speed it up significantly. This may include a hot route, a dump off to a RB, or threow away. But in this case, the defensive line did have an effect on the Quarterback decision making and timing, thus the value of 2 points.
Sacks are obviously what every defense wants. It is loss of yardage and a down. It includes a knockdown. Clearly this is the most valuable form of pressure so it is assigned 5 points.
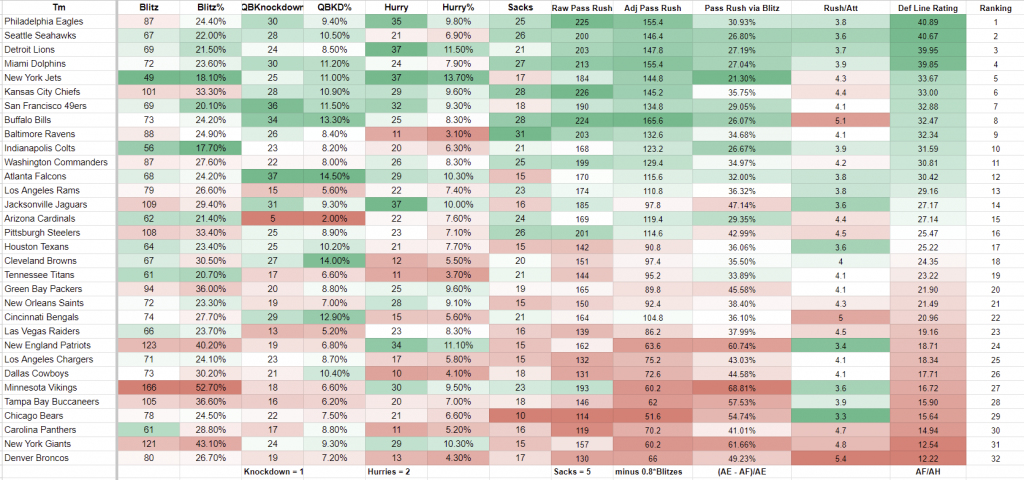
So let’s look at the Philadelphia Eagles metrics and how we calculate the raw pass rush rate. The Eagles have 30 Knockdowns, 35 Hurries, & 25 sacks:
Philadelphia Eagles Raw Pass Rush = 30*(1) + 35*(2) + 25*(5) = 30 + 70 + 125 = 225
Now we need to adjust for blitzing to create Adjusted Pass Rush. The assumption here is that all teams would prefer to get pressure without having to blitz. It is ok to blitz, but the blitzing must result in increased pressure as blitzing by its very nature weakens pass coverage. Teams that have to send the blitz in order to get any pressure are going to penalized the most.
This is going to be the most debatable scoring metric because I don’t really have a great understanding of the success expectation each team uses when deciding whether it is worth the risk to blitz. If most times a team blitzed it failed to get pressure, then unless the team has tremendous players at CB and S, they are going to get chewed up over time for sending extra rushers who do not get home.
So here is what I decided to use. For every 10 times a team blitzes, I expect them to get 1 knockdown, 1 hurry, and 1 sack. By the scoring system I used above that means a total of 8 points every 10 blitzes. Thus to create Adjusted Pass Rush, we will subtract 0.8 points from Raw Pass Rush for every blitz the team sent.
Again let’s look at the Eagles and see how this works out. The Eagles have blitzed 87 times through 8 weeks.
Philadelphia Eagles Adjusted Pass Rush = 225(Raw Pass Rush) – (0.8*87) = 225 – 69.6 = 155.4
What we are trying to do here is estimate the amount of help the line has had in generating pressure and subtract it out leaving just the pressure the line itself generates. And if we take 1 – (155.4) / 225, we get 1 – .6907 = 30.97%. This is the amount of pressure generated by the Eagles blitzes. So the Eagles get almost 70% of their pressure from their Defensive Line.
The final step in the Defensive Line Ratings is to give credit to defensives lines that generate pressure AND are good against the run. To do this we are just going to divide the Adjusted Pass Rush by Avg Rush/Attempt.
So for the final step to generate the Eagles defensive line score, we use their 3.8 rushing yards/attempt stat.
Philadelphia Eagles Defensive Line Score = 155.4 / 3.8 = 40.89
A very good example of a team punished by their high rush yards/ attempt metric are the Buffalo Bills. The Bills actually have the highest Adjusted Pass Rush score(165.6), 10 points higher than the Eagles, meaning the generate a lot of pressure. But the are giving up a whopping 5.1 yards/rush attempt, so while they are getting pressure, it seems as though they are selling out to do so and not staying in rush lanes.
Buffalo Bills Defensive Line Score = 165.6 / 5.1 = 32.47
There are some interesting teams with bad Defensive Line scores including Dallas, New Orleans & Cleveland. All 3 have good to great defenses, but it is most likely the secondary and linebackers on these teams that make them great. But as the spreadsheet and stats show, there is a direct correlation between a good defensive lines and the amount they need to blitz. Only Jacksonville(47.14%), Dallas(44.58%) and Pittsburgh (42.99%) are contending teams generating more than 40% of their pressure by blitzing.

At the other end of the spectrum, the Jets blitzing 49 times has only contributed 21.3% to their Raw Pass Rush. The get almost 80% of their pressure via their defensive line. The Bills are 2nd best at 26.07% of pressure generate by the blitz, so that 21.3% rate of the NY Jets is extra special(roughly 20% better than the 2nd best Bills).
Since this is a new metric and a slightly arbitrary one, I am sure there will be arguments and improvements to come. Just remember this metric is only rating the defensive line play and not the entire defense.
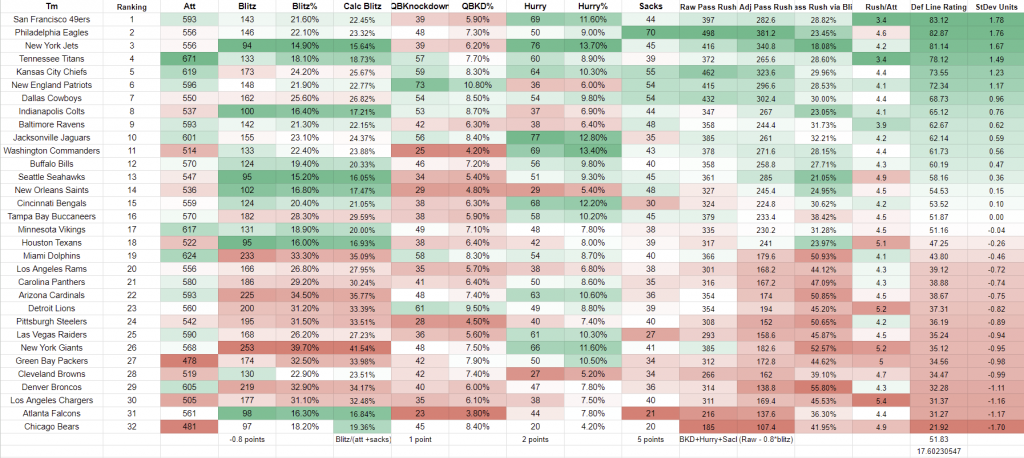
At the bottom of the post you will find the 2022 Defensive Line Ratings using the same method. It shows a great contrast between the 49ers defensive line, who put up average sack totals but were extremely stout against the run, and the Eagles defensive line, who put up epic sack totals, but were below average against the run.
Enjoy the football and best of luck to your team this Sunday.

Note – I tried different ways to calculate 2022 Blitz % as it does not seem to align with the other defensive stats. In this spreadsheet I defined Calc Blitz % = (Blitzes) / (Pass Attempts + Sacks) which should equate to all the times the defense faced a drop back by the QB. Still the Calucalted Blitz % comes in at about 1% – 1.5% higher than the PFR Blitz %. It is a small error that does not effect any calculation but it is a bit annoying.

