
Goodbye QB Rating & QBR. Hello QB Score – QBS
QB Score QBS – Comparative QB Ratings
QB Score, QBS, is a new QB metric that attempts to solve an extremely tricky problem. Rating and ranking quarterbacks is a difficult process. Their ability is dependent upon playcalling, offensive line play, receiver options, and intelligent defenders attempting to muck up everything they do. If left in a vacuum, with no pressure, almost all NFL QBs would show similar abilities, albeit with different levels of skills.
This article will focus on how QB Score is calculated and why it is different. I will run the data again after week 9, and then do an article giving out Midterm grades to all NFL quarterbacks using QB Score and other metrics. But for now, let’s start with the current metrics for rating quarterbacks.
The two current popular methods of rating QB play have been QB rating and QBR. QB Rating is the 4 part, draconian formula that almost no one on the planet could quote correctly, and fewer still could perform all the calculations off-hand needed to produce the rating. If you are interested, I included the formula at the bottom of the article.
QBR involves dividing up Expected Points based on QB play. The cool thing about QBR, in theory, is that the QBR rating is the % chance the QB/Team has of winning the game(all other things held equal/constant). If you have read anything on NFLLINES.com you know Expected Points is a fave, but the calculations for QBR are even more complicated the QB rating. To even begin calculating QBR you need to be able to calculate Expected Points for the offense. If you would like to read what ESPN has to say about their own QBR formula, you can do here: ESPN QBR Explanation
The thing QB Rating and QBR have in common is that the QB rating is independent of other QB play. Both are calculated in regard to the statistics the QB produced. Nothing in the calculation of the QB ratings or QBR is comparative to other QB play or stats. Only the final rating itself is comparable, but even then it is not dependent on any other QB’s rating or play. This is where QB Score differs.
Why QB Score?
QB Score, QBS, is derived from comparing the stats of all quarterbacks to each other and then scoring each QB in a 11 categories. To do the scoring, QBS uses Standard Deviation units. Essentially the better a QB is compared to all his fellow QBs in that metric, the higher the score he receives for that metric.
The argument for using QBS is pretty clear:
- It is the most intuitive of the QB rating scales with an average of virtual zero and the smallest range.
- QBS is the easiest QB rating metric to calculate
- QBS is the only comparative QB rating system that takes into account the QB’s performance compared to their peers.
- Quantifying the QBS score to a descriptive adjective on the QB play is simplest due the inherent ranges in its scoring system.
QB Score Metrics
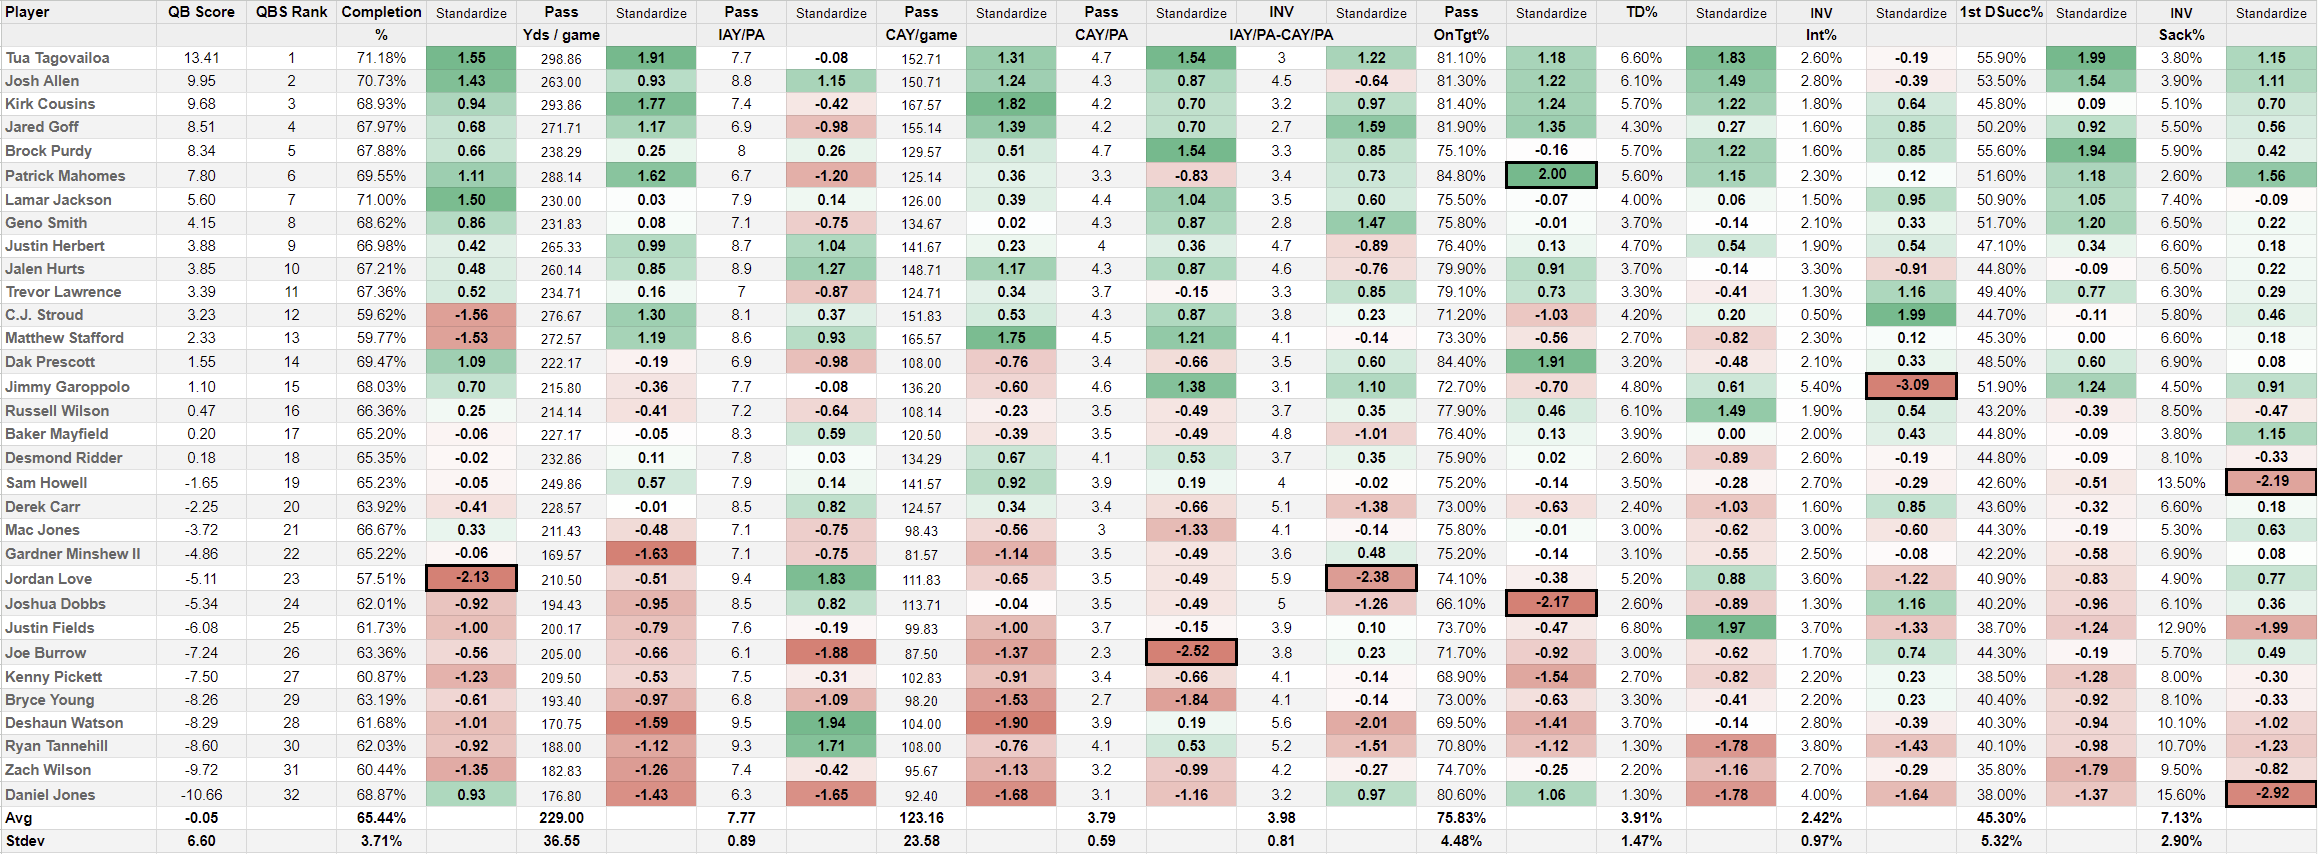
Here is the process for calculating QBS. All NFL QBs are scored in 11 statistics:
- Completion %
- Passing Yards / Game
- Intended Air Yards / Pass Attempt
- Completed Air Yards / Game
- Completed Air Yards / Pass Attempt
- Intended Air Yards/ Pass Attempt – Completed Air Yards / Pass Attempt (Inverse)
- On Target %
- Touchdown %
- Interception % (Inverse)
- 1st Down Success %
- Sack % (Inverse)
You’ll notice that 3 statistics have (Inverse) next to them. This simply means when calculating, a lower value is better. It is better to have a low INT% and Sack% so the stat/score is inverted. At the bottom of every metric you can see the average and the size of 1 unit SD range.
Intended Air Yards – The Gunslinger Metric
Every metric you see above you may have seen before or know already with the exception of two: the metrics involving Intended Air Yards. First, Intended Air Yards is simply the measure of how far the QB threw the ball on all attempts, whether complete,or incomplete. For example, a QB attempts a 10 yard pass but it is incomplete. Intended Air Yards is 10, but Completed Air Yards is zero. If the pass was complete and the receiver ran for 6 yards after the catch: Intended Air Yards is 10, Completed Air Yards is 10, YAC is 6, and Passing Yards are 16.
I am calling this the Gunslinger metric, and here is why it is included. Ideally you would love to have a QB willing, and able, to push the ball downfield. So let’s reward the ones who do in QBS. All other metrics being equal, we would love it if our QB threw for 9 intended air yards every attempt as opposed to 6, because all other things being equal(including completion %), we would move down the field faster.
But all other things are not equal…Completion % decreases as intended air yards increase(its harder to complete a longer pass than a shorter one in most cases). The ball literally takes longer to travel 9 yards as opposed to 6 yards giving defense more time to react. Most importantly, most NFL defenses are set up to minimize long pass completions in exchange for shorter ones. So a gunslinger QB who is always trying to go deep needs to be kept in check in QBS by making sure they are not just flinging it willy nilly downfield.
The way this is done is with the second metric, (Intended Air Yards / PA – Completed Air Yards / PA), a metric I made up. I call this metric, The Take What The Defense Is Giving You Metric. This is how it works…By taking IAY/PA and subtracting CAY/PA we are seeing if the QB is trying to go deep too often. Essentially, NOT taking what the defense gives them.
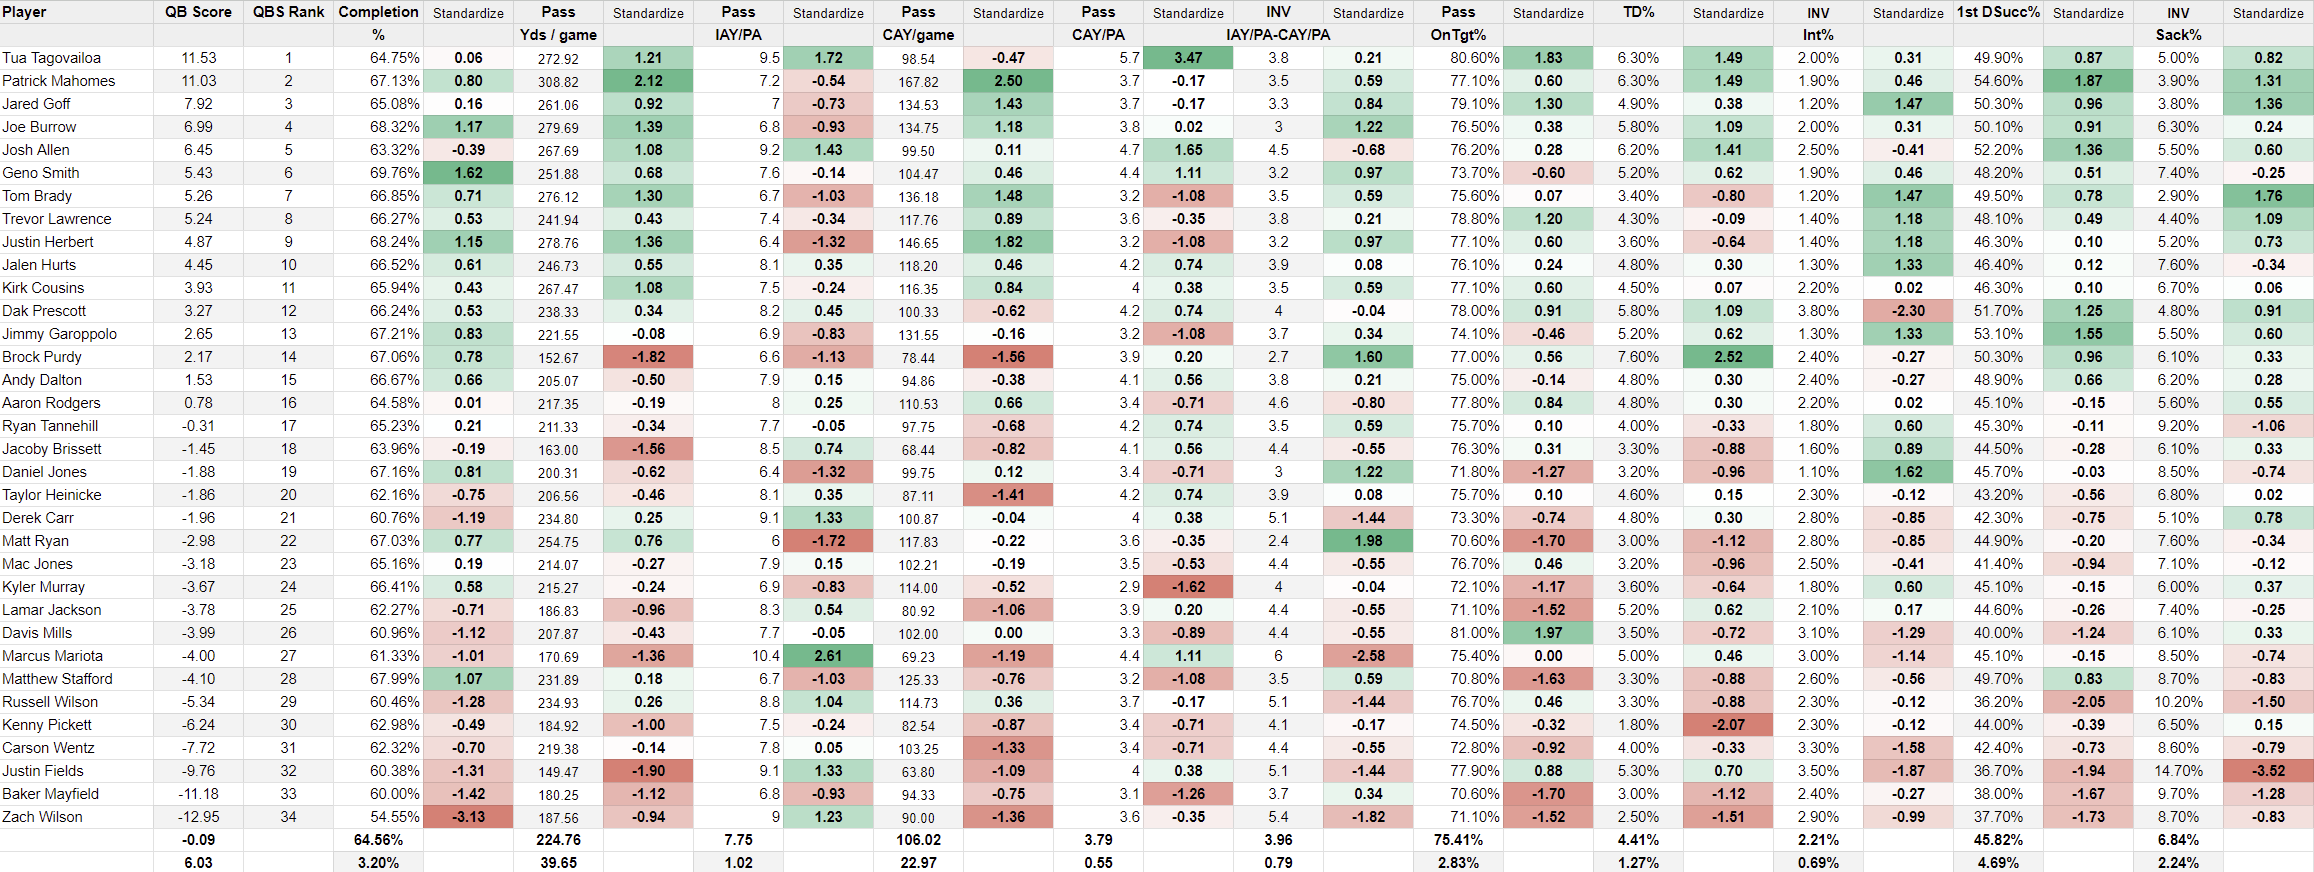
To illustrate this new metric, let’s look at two QBs: Jared Goff & Jordan Love. You will see the metric and next to it in parenthesis will be the StDev points awarded.
Jared Goff: IAY/PA = 6.9 (-0.98) CAY/PA = 4.2 (0.70) Difference = 2.7 (1.59)
Jordan Love: IAY/PA = 9.4 (1.83) CAY/PA = 3.5 (-0.48) Difference = 5.9 (-2.38)
So what does this tell us? Jared Goff does not go downfield when compared to other quarterbacks. His 6.9 yards per attempt of intended air yards places him 0.98 StDev below average(which for IAY/PA is 7.77 yards). However his CAY/PA is 4.2 yards which is good enough to be 0.70 StDev above average. And the difference between IAY/PA and CAY/PA is a mere 2.7 yards. Basically, Jared Goff takes what the defense gives him, even if it is a bit conservative compared to the other NFL QBs on average. Goff is punished for not being aggressive(-0.98), but the reward for taking the yardage available makes up for it(1.59). If you take into account the CAY/PA score(0.70), Goff scores 1.31 StDev in the 3 metrics.
Now let’s look at Jordan Love. He has a 9.4 yard IAY/PA stat, second only behind Deshaun Watson’s 9.5. So he is a Gunslinger and gets rewarded in this metric with a whopping 1.83 StDev points. But his CAY/PA is a mere 3.5 yards, good for -0.48 StDev points and the difference between his intended air yards and actual completed air yards is a massive 5.9 yards per attempt. This -2.38 StDev is an outlier. It is so bad it really shouldn’t happen. Jordan Love is gunslinging, missing, and NOT taking what the defense gives him. So everything he gained by being a gunslinger(1.83) is lost for being careless(-2.38). If you take into account the CAY/PA score(-0.48), Love scores -1.03 StDev in the 3 metrics.
It is this counter balance metric of IAY/PA – CAY/PA that can really help show which quarterbacks are seeing the field. A qb that can throw the ball downfield furthest will still completing for a majority of the yards will score highest in the two IAY metrics. The Gunslinger chart below shows an Inverse relationship between IAY/PA & IAY/PA – CAY/PA.
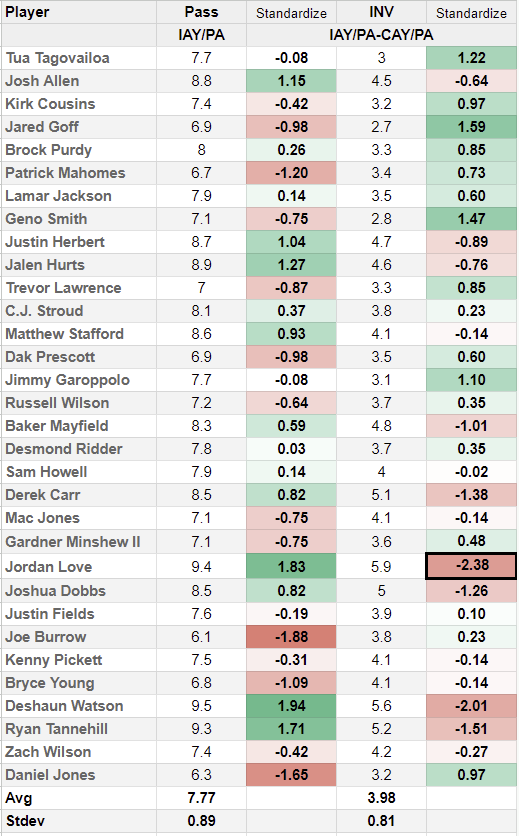
Basically the more of a gunslinger the QB is(high value in column S and high points in column T), the more likely they are to have a high value in column AC(difference between intended and completed) and a low score in AD. Remember this is an INVERSE metric, lower is better for identifying who is taking the yards available and who is pressing to throw long too often. Thus the more aggressive a QB is, the more likely they are to be unsuccessful doing so.
In almost every case, if a QB is a gunslinger, green in column T, they will be red in in column AD. This means there is a large difference between their intended yards and their completed yards.
On the other hand, if the quarterback is more conservative, red in column T, they have a high chance of being green in column AD. Basically they are getting a much higher % of completed yards in relation to their intended yards because they are not pushing the ball as far down the field. The best quarterbacks will push the limit to how far downfield they can without jeopardizing ball security. Quarterback with low intended air yards will tend to score higher in IAY/PA – CAY/PA because they are taking less chances.
There are 4 quarterbacks who are green in both metrics: Brock Purdy, Lamar Jackson, C.J. Stroud, & Desmond Ritter!
Analyzing The First QBS Metric – Completion %
Let’s look at Completion % as an example of how the QB Score for that metric is calculated:
- We take the Average of all the data in the Completion % column. This is 65.44%
- We take the standard deviation of the data in the column. The StDev is 3.71%
- We use the Average and the StDev value to create the SD points awarded for the statistic
Let’s expand on #3. All Standard deviation is doing is trying to fit all the data in the column into Standard deviation ranges. It would like to fit 2/3 or 67% of all the data into a range that is 1 SD above average and 1 SD below average. It would like to fit 95% of all data into a range of 2 SD from Average.
Anything outside 2 SD above or below average is typically an Outlier(these are marked on the QBS chart by thick black box borders around the value). These are scores/stats that are significantly better or worse than expected. 99% of all data should fit within 3 SD of average, so any SD value over 3.00 is an extreme outlier.
For example, Daniels Jones sack rate % of 15.60 is so horrendous it is 2.92 SD below average. That level of terrible is bordering on impossible. Conversely, Tua Tagovailoa’s QBS score is 2.04 SD above average. His QB score itself is an outlier! This speaks to how great a season he is having statistically through 7 weeks.
SD Meaning
3SD+ Above Average = WOW
2 SD Above Average = Great
1SD Above Average = Good
Average = Average
1SD Below Average = Bad
2SD Below Average = Terrible
3SD Below Average or worse = WTF
Testing a QBS Metric
Completion %
3 SD+ Above Average = 76.57% or more
2 SD Above Average = 72.86%
1SD Above Average = 69.15%
NFL Completion % Average = 65.44%
1SD Below Average = 61.73%
2SD Below Average = 58.02%
3SD+ Below Average = 54.31% and below
So let’s test this right off the bat. How many completion % rates fall outside the range of 58.02% – 72.86%?
The answer, exactly one. Jordan Love’s 57.51% rate fall below 2SD. So 1 out of 32 completion % ratings fell outside the +-2SD range. 1/32 is roughly 3%.
No completion % is outside 3SD, 99% of the data is inside that range. So StDev did exatly what it is supposed to do, fit 95% of the data into a range of +-2SD and 99% inside +-3SD.
The Case for QB Score – QBS
For scoring, all we have to do is take the actual StDev value. Do that for all 11 metrics, add them all up, and you get QB Score, or QBS. The major difference being that, in QBS each QB is scored in each metric based on their performance AGAINST ALL OTHER QUARTERBACKS in that metric. While it does matter what the Qb did in the game on Sunday, it is also dependent on what all other QBs did on Sunday as well.
The second thing that makes QBS easier to understand and calculate, is that the average QBS score is essentially zero(-0.05 thru week 7). That is pretty easy to remember compared to avg QB Rating of 89.32 and an average 53.58 for QBR. A quarterback with a positive QBS is performing above average, one with a negative QBS is performing below average. Again pretty simple to use.
The third thing that makes QBS the better QB metric is that it has the smallest range of values. The current range for QB is -10.66 to 13.41 Through Week 7, the current range for QB Rating is 71.7 – 110.4, and the range for QBR is 32.1 to 76.9. With QBS, using StDev of the QB Scores themselves, we can easily assign grades or performance buckets to the range.
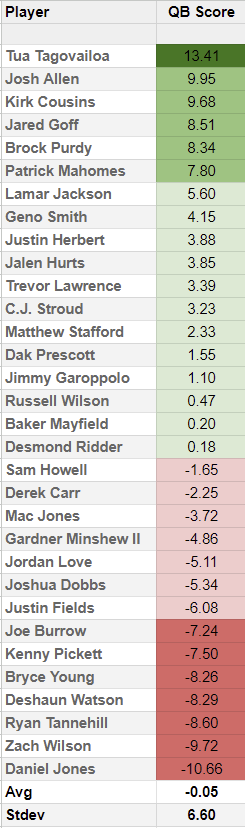
The avg QB Score is -0.05, and the StDev is 6.60.
QB Score Interpretation
13.16+ = Exceptional
6.56 – 13.15 = Good to Excellent
-0.05 – 6.55 = Slightly above average to Good
-0.05 – -6.65 = Slightly below average to Bad
-6.66 – 13.25 = Bad to Horrible
-13.26 or lower = WTF?!
We are being pretty pedantic by not just calling 0.00 the average rating, but this is what was meant by it being virtually zero. QB Score is a lot easier and clearer than either QB Rating or QBR when it comes to figuring out what the number translates into with regards to summarizing the QB’s performance. The chart below will help crystalize it.
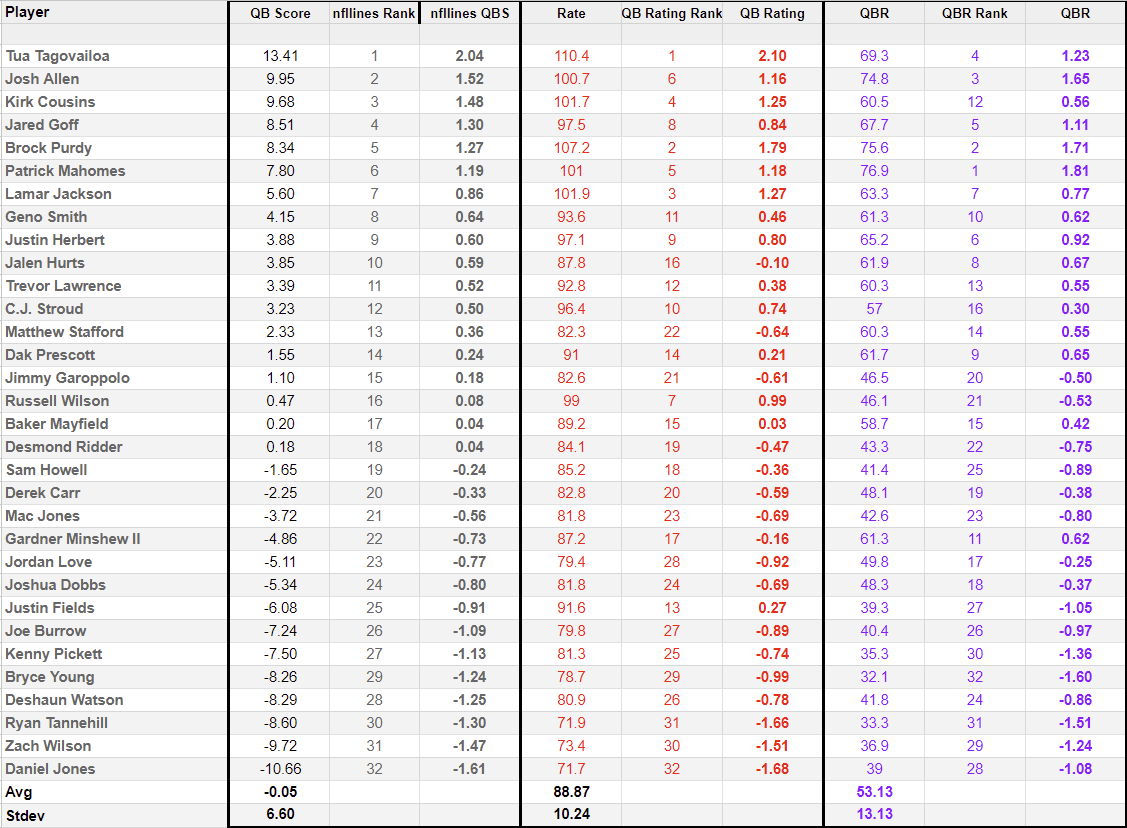
Converting QB Rating & QBR Into Standard Deviation Units
The chart shows QB Score, QB Rating, & QBR scores and ranks for every quarterback. The extra column shows how many SD above or below the average for the rating each QB happens to be. We are converting QB rating and QBR into quasi-QBS in order to compare them. Thus trying to measure/compare them Apples to Apples to Apples.
QBS has a range of 2.04(Tagovailoa) down to -1.61(D.Jones)
QB Rating has a range for 2.10(Tagovailoa) down to -1.68(D.Jones)
QBR has a range of 1.81(Mahomes) down to -1.60(B. Young)
Thus both QB rating and QBR show the same StDev range and characteristics as QBS. However they are murkier and more confusing in both the calculation and interpretation.
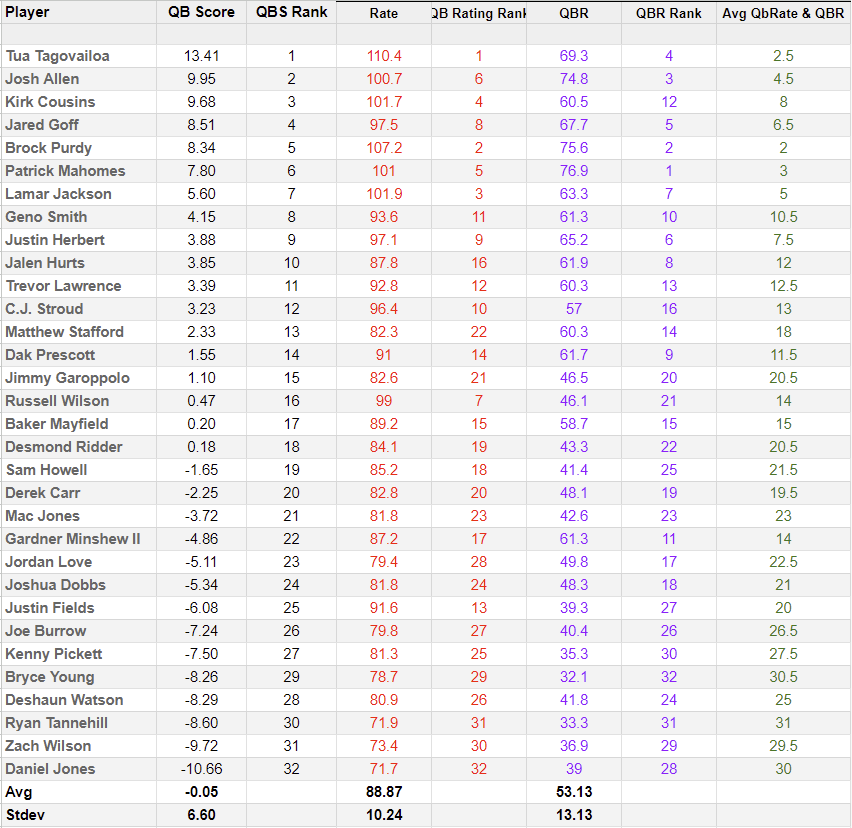
QBS vs QB Rating vs QBR Quarterback Ranks
Here then is a final chart showing QBS vs QB Rating vs QBR vs the avg of QB Rating & QBR. Just like Qb rating and QBR disagree on the rankings for QBs, QBS chimes in with its own unique rankings. However it is fair to say that QBS did not stray wildly from either QB ratings or QBR is its scoring or rankings. As can be seen in the chart, QBS aligns closer to QB rating than QBR, but it will also agree with QBR on some rankings.
Take a look at QBS and come to your own conclusion. Come back in 2 weeks for the midterm qb grades using QBS and other advanced passing metrics. Best of luck to your team this weekend.
Here are the QB Scores broken down into the Standard Deviation ranges.
Dark Green = +2sd through +3sd = Excellent
Green = +1sd through +2sd = Good To Great
Light Green = 0 through 1sd = slightly above average to good
Light Red = 0 through -1sd = slightly below average to bad
Red = -1sd through -2sd = Bad to Terrible
Dark Red – No QB falls below -2sd(-13.25)
As promised here is the QB Ratings Formula if you would like to spend a few hours calculating every QB rating.
QB Ratings Formula
The four separate calculations can be expressed in the following equations:


where
- ATT = Number of passing attempts
- CMP = Number of completions
- YDS = Passing yards
- TD = Touchdown passes
- INT = Interceptions
If the result of any calculation is greater than 2.375, it is set to 2.375. If the result is a negative number, it is set to zero.
Then, the above calculations are used to complete the passer rating:
