
QB Score v2.0 – QBS – Comparative NFL Quarterback Ratings
QB Score QBS – Comparative QB Ratings
This is the second article introducing QB Score, QBS. This article will be a second edition of the first article in that many of the explanations will be the same, however the metrics and stats used in computing QB Score have changed. Thus, the rankings themselves have changed. Here is the full list and breakdown for every starting NFL QB – NFL 2023 Midseason QB Scores.
Why QBS v2.0? The original QB Score article and rankings were posted to Reddit /r/NFL page where we asked for criticisms, suggestions, and input. The #1 criticism was that modern mobile quarterbacks were being punished, or not rewarded, by QBS(which, quite frankly, is the #1 criticism of Passer Rating, and to an extent, QBR). If you would like to read the original article introducing QBS, you can do so here: Goodbye QB Rating & QBR. Hello QB Score – QBS.
This article will focus on how QB Score is calculated and why it is different. The two current popular methods of rating QB play have been Passer Rating and QBR. Passer Rating is the 4 part, draconian formula that almost no one on the planet could quote correctly, and fewer still could perform all the calculations off-hand needed to produce the rating. If you are interested, I included the formula at the bottom of the article.
QBR involves dividing up Expected Points based on QB play. The cool thing about QBR, in theory, is that the QBR rating is the % chance the QB/Team has of winning the game(all other things held equal/constant). To even begin calculating QBR you need to be able to calculate Expected Points for the offense. If you would like to read what ESPN has to say about their own QBR formula, you can do here: ESPN QBR Explanation.
The thing Passer Rating and QBR have in common is that the rating is independent of other QB play. Both are calculated in regard to the statistics the QB produced. Nothing in the calculation of the Passer ratings or QBR is comparative to other QB play or stats. Only the final rating itself is comparable, but even then it is not dependent on any other QB’s rating or play. This is where QB Score differs.
Why QB Score?
QB Score, QBS, is derived from comparing the stats of all quarterbacks to each other and then scoring each QB in 14 categories. To do the scoring, QBS uses Standard Deviation units. Essentially the better a QB is compared to all his fellow QBs in that metric, the higher the score he receives for that metric.
The argument for using QBS is pretty clear:
- It is the most intuitive of the QB rating scales with an average of virtual zero and the smallest range.
- QBS is the easiest QB rating metric to calculate
- QBS is the only comparative QB rating system that takes into account the QB’s performance compared to their peers.
- Quantifying the QBS score to a descriptive adjective on the QB play is simplest due the inherent ranges in its scoring system.
QB Score Metrics
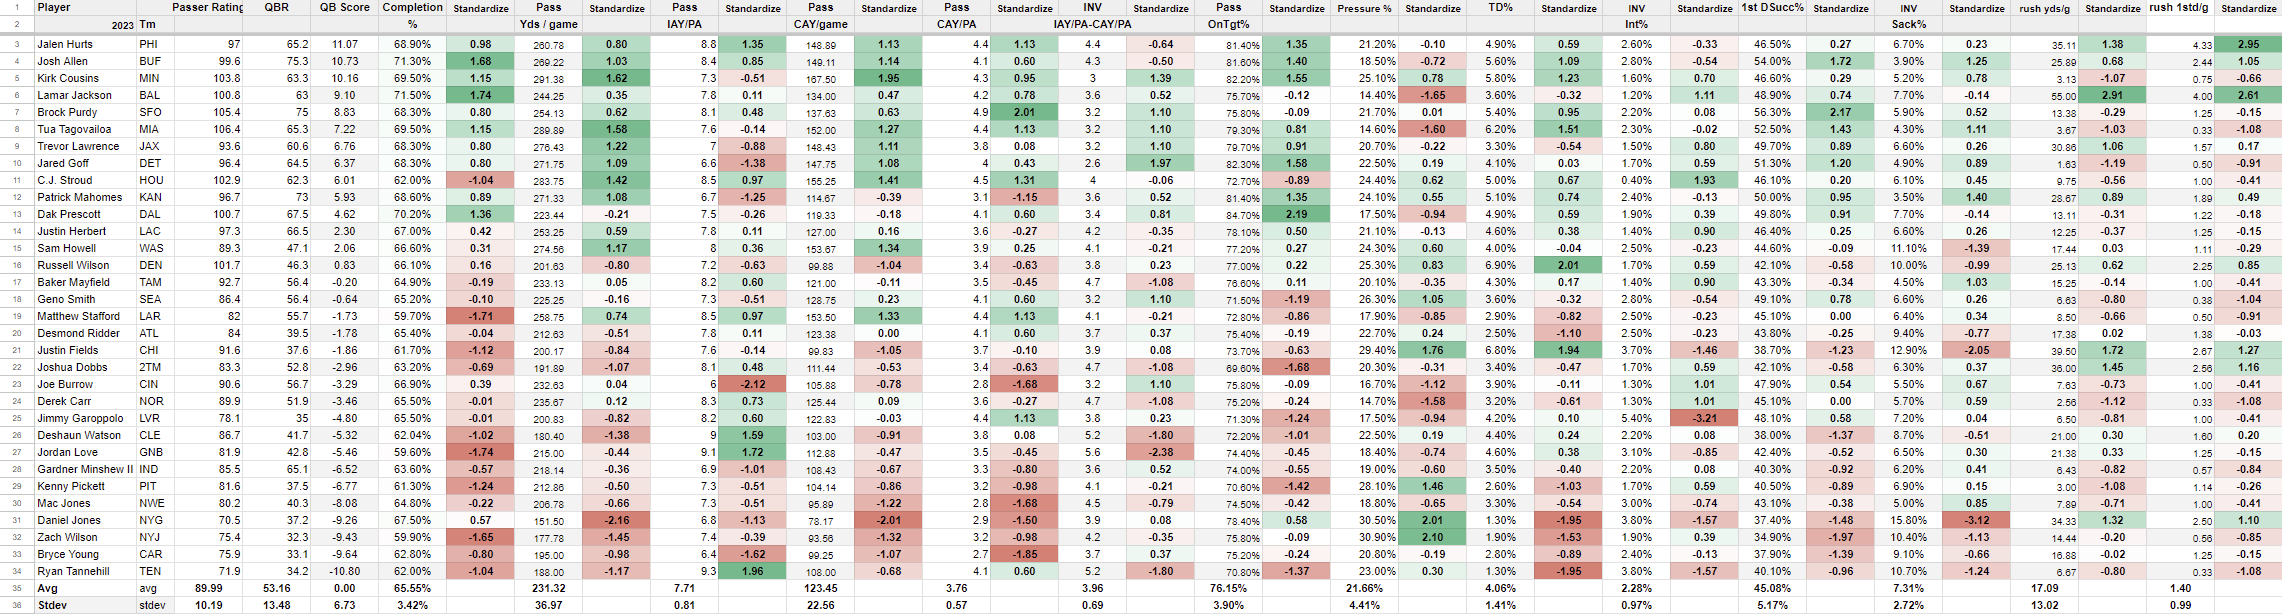
Here is the process for calculating QBS. All NFL QBs are scored in 14 statistics:
- Completion %
- Passing Yards / Game
- Intended Air Yards / Pass Attempt
- Completed Air Yards / Game
- Completed Air Yards / Pass Attempt
- Intended Air Yards/ Pass Attempt – Completed Air Yards / Pass Attempt (Inverse)
- On Target %
- Touchdown %
- Interception % (Inverse)
- 1st Down Success %
- Sack % (Inverse)
- Pressure % (Inverse)
- Rushing Yardage
- Rushing 1st Downs
You’ll notice that 4 statistics have (Inverse) next to them. This simply means when calculating, a lower value is better. It is better to have a low INT% and Sack% so the stat/score is inverted. At the bottom of every metric you can see the average and the size of 1 unit SD range. The 3 new QBS v2.0 metrics are in bold italics at the bottom of the list.
Upon the release of the first version of QBS, there was suggestion that it was not rewarding more mobile quarterbacks for their play extending, and play creating talents. Essentially that QB Score was too focused on the actual throwing of the football as opposed to scoring the position of quarterback. A good way to think of it is that QBS would measure and rate all of Tom Brady, but only 3/4 of Lamar Jackson.
This is a fair criticism and something that needed to be tweaked if QBS was going to rate quarterbacks, and not just the ability of quarterbacks to throw the ball. However, it had to be limited. Even in seasons when Lamar Jackson ran for 1000 yards, he was still passing for about 3000 yards and these are the most exteme cases of rushing yds vs passing yds for quarterbacks. A fair estimate is probably more like 500 yards rushing per 3000 yards passing is the sign of a mobile qb. As a ratio this means about 1/7 (500/3500) of the QB’s production is rushing, 6/7(3000/3500) is passing. 1/7 translates into roughly 14.3%, and for extremely mobile quarterback it could range as high as 25%(Jackson in 2019 & 2020).
Thus the ability to rush and avoid pressure should count for about 15%-20% of a quarterbacks value. There are now 2 out of 14 metrics strictly dedicated to a quarterbacks rushing ability, or 1/7. Considering the Pressure % metric is intended to reward quarterbacks under pressure, it is also recognizing the value of a mobile quarterback. Thus we come to that 15%-20% area. Ideally, QB Score would be flexible and robust enough to identify the best all around quarterback of that year whether the qb was a statuesque Tom Brady, or a Tasmanian Devil like Lamar Jackson.
New Metrics in QB Score
Pressure % (Inverse)
The Pressure % metric has been added to balance out how much time each quarterback has had to produce their statistics. This is an INVERSE metrics so QBs who are facing a high % of pressure will score higher, and quarterbacks facing minimal pressure will score lowest.
The logic for including this revolves around protection scheme and line play. If a qb faces pressure a smaller % of the time, they should, all other things held equal, produce better statistics. They are not being rushed, or running for the lives as much. They are sitting in a clean pocket, scanning the field, and can step into throws.
Likewise, a quarterback that is under pressure a high % of the time is most likely having to make quicker reads, scramble, and work from dirtier pockets. Again, all other things being equal, a qb facing a high % of pressure will typically produce worse stats than a qb facing a low % of pressure.
A modern mobile quarterback is going to be helped by this metric as they will be more capable of producing positive stats after being flushed. They simply deal with pressure better than a statuesque type quarterback.
If a team wants to Max Protect a quarterback to mimizize pressure %, that is fine, but the quarterback will be expected to produce better stats when Max Protected then when not Max Protected. Simply put, if a qb is not performing better with extra blockers, it would be better to send the blockers out as receivers. Their value as extra protection is zero.
One of the reasons Tom Brady is Tom Brady is because he often faced a small % of pressure. Take an exceptional qb, add in a bit more time in the pocket via more protection(which increases his production), and you end up with a GOAT.
And while I don’t think Zach Wilson is Tom Brady, I am not sure Zach Wilson is as bad as Zach Wilson IF Zach Wilson wasn’t facing an inordinately high amount of pressure.
Rushing Yardage
This one is as straightforward as it gets. Quarterbacks who rush the ball effectively will score high in this metric. Tom Brady will not.
This metric has nothing to do with throwing the football, but has something to do with playing modern QB in the NFL. The only small issue with this metric is the large rushing yardage range between the best of the running QBs and the Pocket Passers. But using StDev units, the damage of a single metric with an unusual range is always limited.
Rushing 1st Downs
This metric is a double barrel for rushing quarterbacks. By choosing rushing 1st downs as a metric I also included rushing touchdowns. How? In the NFL every touchdown scored by rushing or passing, regardless of the distance covered, is awarded a first down Guide for NFL Statisticians.
For example, Jalen Hurts gets Tush Pushed from the 1 yard line in for a touchdown. Hurts would get credit for 1 yard rushing, a rushing td, and a rushing 1st down. So as you can see by using the rushing first down metric, we can give credit for qb rushing touchdowns without adding the extra metric.
Intended Air Yards – The Gunslinger Metric
Every metric you see above you may have seen before or know already with the exception of two: the metrics involving Intended Air Yards. First, Intended Air Yards is simply the measure of how far the QB threw the ball on all attempts, whether complete, or incomplete.
For example, a QB attempts a 10 yard pass but it is incomplete. Intended Air Yards is 10, but Completed Air Yards is zero. If the pass was complete and the receiver ran for 6 yards after the catch: Intended Air Yards is 10, Completed Air Yards is 10, YAC is 6, and Passing Yards are 16.
I am calling this the Gunslinger metric, and here is why it is included. Ideally you would love to have a QB willing, and able, to push the ball downfield. So let’s reward the ones who do in QBS. All other metrics being equal, we would love it if our QB threw for 9 intended air yards every attempt as opposed to 6, because all other things being equal(including completion %), we would move down the field faster.
But all other things are not equal…Completion % decreases as intended air yards increase(its harder to complete a longer pass than a shorter one in most cases). The ball literally takes longer to travel 9 yards as opposed to 6 yards giving defense more time to react. Most importantly, most NFL defenses are set up to minimize long pass completions in exchange for shorter ones. So a gunslinger QB who is always trying to go deep needs to be kept in check in QBS by making sure they are not just flinging it willy nilly downfield.
The way this is done is with the second metric, (Intended Air Yards / PA – Completed Air Yards / PA), a metric I made up. I call this metric, The Take What The Defense Is Giving You Metric. This is how it works…By taking IAY/PA and subtracting CAY/PA we are seeing if the QB is trying to go deep too often. Essentially, NOT taking what the defense gives them.
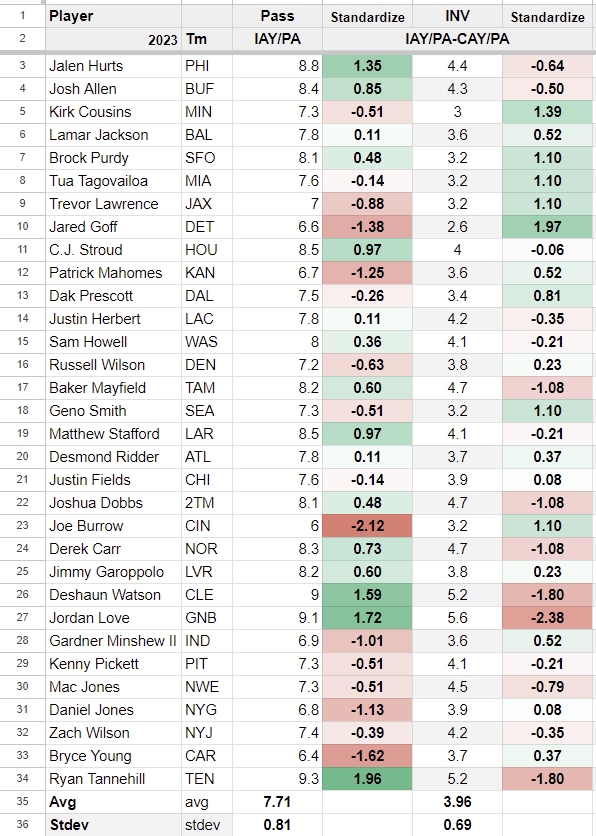
Basically the more of a gunslinger the QB is(high value in column S and high points in column T), the more likely they are to have a high value in column AC(difference between intended and completed) and a low score in AD. Remember this is an INVERSE metric, lower is better for identifying who is taking the yards available and who is pressing to throw long too often. Thus the more aggressive a QB is, the more likely they are to be unsuccessful doing so.
In almost every case, if a QB is a gunslinger, green in column T, they will be red in in column AD. This means there is a large difference between their intended yards and their completed yards.
On the other hand, if the quarterback is more conservative, red in column T, they have a high chance of being green in column AD. Basically they are getting a much higher % of completed yards in relation to their intended yards because they are not pushing the ball as far down the field. The best quarterbacks will push the limit to how far downfield they can without jeopardizing ball security. Quarterback with low intended air yards will tend to score higher in IAY/PA – CAY/PA because they are taking less chances.
Analyzing The First QBS Metric – Completion %
Let’s look at Completion % as an example of how the QB Score for that metric is calculated:
- We take the Average of all the data in the Completion % column. This is 65.55%
- We take the standard deviation of the data in the column. The StDev is 3.42%
- We use the Average and the StDev value to create the SD points awarded for the statistic
The unit of measure is Standard deviation units (StDev). Very simply, StDev units measure how unusually good or bad a statistic is compared to the range it is in. In mathematics:
- 68.26% of the data should fit within +/- 1 StDev unit
- 95.44% of a data range should fit within +/- 2 StDev units,
- 99.72 % within +/- 3 StDev units.
Remember the old Bell Curve that your teacher would use to adjust test scores? The Bell Curve is simply a graphically representation of normal probability distribution. That is a lot of mathematical jargon that boils down to the Bell Curve is showing Standard Deviation in picture form. The greek letter sigma σ is the mathematical symbol for STDev Units.
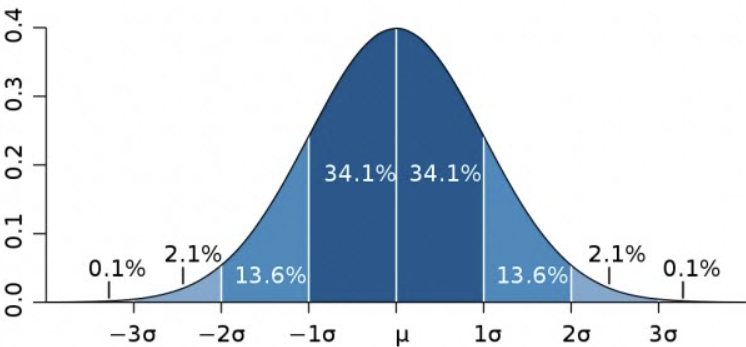
Anything outside 2 SD above or below average is typically an Outlier. These are scores/stats that are significantly better or worse than expected. 99% of all data should fit within 3 SD of average, so any SD value over 3.00 is an extreme outlier.
For example, Daniels Jones sack rate % of 15.80% is so horrendous it is 3.12 SD below average. That level of terrible is bordering on impossible.
SD Meaning
3SD+ Above Average = WOW
2 SD Above Average = Great
1SD Above Average = Good
Average = Average
1SD Below Average = Bad
2SD Below Average = Terrible
3SD Below Average or worse = WTF
Testing Completion % QBS Metric
Completion %
3 SD+ Above Average = 75.81% or more
2 SD Above Average = 72.39%
1SD Above Average = 68.97%
NFL Completion % Average = 65.55%
1SD Below Average = 62.13%
2SD Below Average = 58.71%
3SD+ Below Average = 55.29% and below
So let’s test this right off the bat. How many completion % rates fall outside the range of 58.71% – 72.39%?
The answer, none. Jordan Love has the lowest completion % at 59.6%. This is still in the -1sd to -2sd range(which ends at 58.71%). Lamar Jackson leads the league in Completion % at 71.50%, well below the top of the 2sd range(72.39%).
Naturally no completion % is outside 2SD, 99% of the data is inside that range. So StDev did exatly what it is supposed to do, fit 95% of the data into a range of +-2SD and 99% inside +-3SD. In this case it fit all 100% of the data with 2sd.
The Case for QB Score – QBS
For scoring, all we have to do is take the actual StDev value. Do that for all 14 metrics, add them all up, and you get QB Score, or QBS. The major difference being that, in QBS each QB is scored in each metric based on their performance AGAINST ALL OTHER QUARTERBACKS in that metric. While it does matter what the quarterback did in the game on Sunday, it is also dependent on what all other QBs did on Sunday as well.
The second thing that makes QBS easier to understand and calculate, is that the average QBS score is literally 0.00 through 9 weeks. That is pretty easy to remember compared to avg Passer Rating of 89.99 and an average 53.16 for QBR. A quarterback with a positive QBS is performing above average, one with a negative QBS is performing below average. Again pretty simple to use.
The third thing that makes QBS the better QB metric is that it has the smallest range of values. The current range for QB is -10.80 to 11.07 Through Week 9, the current range for Passer Rating is 70.5 – 106.4, and the range for QBR is 32.3 to 75.3. With QBS, using StDev of the QB Scores themselves, we can easily assign grades or performance buckets to the range.
The avg QB Score is 0.00, and the StDev is 6.73.
QB Score Interpretation
13.47+ = Exceptional
6.74 – 13.46 = Good to Excellent
0.00 – 6.73 = Slightly above average to Good
0.00 – -6.73 = Slightly below average to Bad
-6.74 – 13.46 = Bad to Horrible
-13.47 or lower = WTF?!
QB Score is a lot easier and clearer than either Passer Rating or QBR when it comes to figuring out what the number translates into with regards to summarizing the QB’s performance. The chart below will help crystalize it.
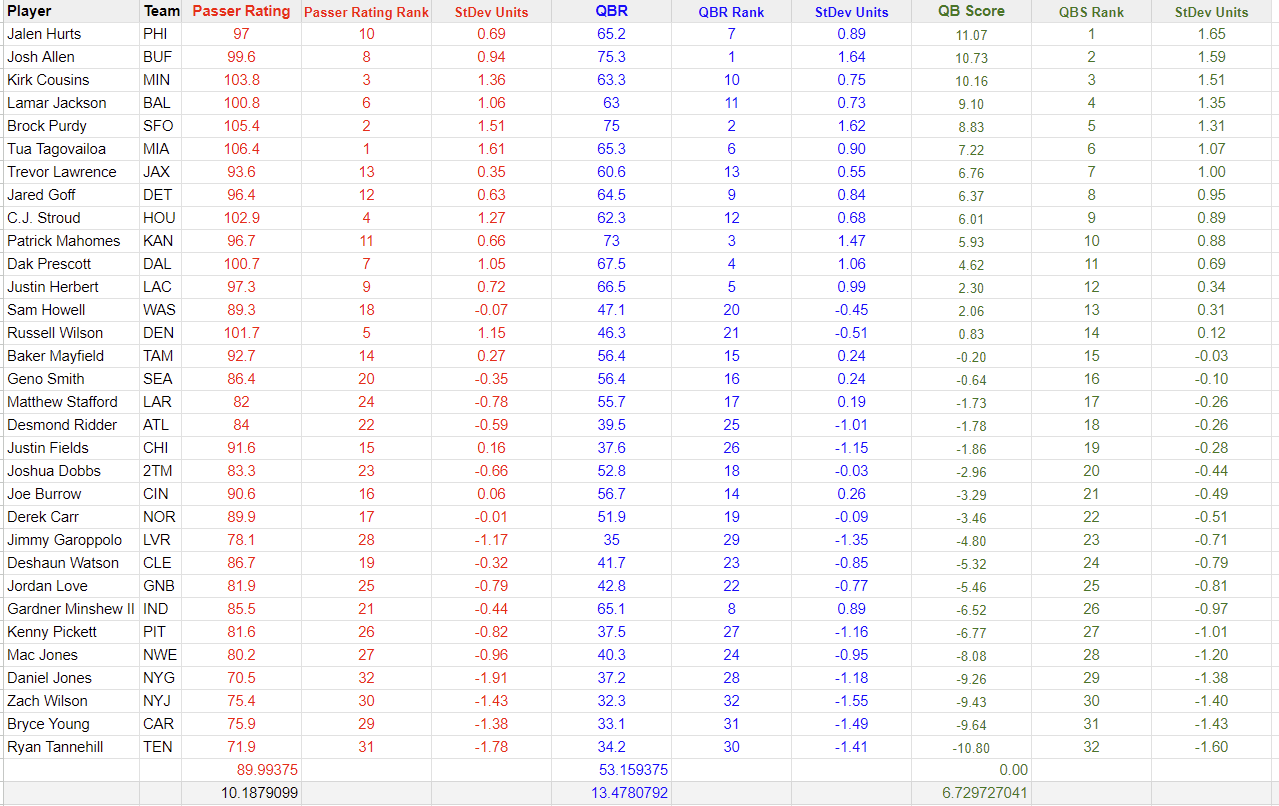
QB Score vs Passer Rating vs QBR
The chart shows QB Score, Passer Rating, & QBR scores and ranks for every quarterback. The extra column shows how many SD above or below the average for the rating each QB happens to be. We are converting Passer rating and QBR into quasi-QBS in order to compare them. Thus trying to measure/compare them Apples to Apples to Apples.
Converting Passer Rating & QBR Into Standard Deviation Units
QBS has a range of 1.65(Hurts) down to -1.60(Tannehill)
Passer Rating has a range for 1.61(Tagovailoa) down to -1.71(Tannehill)
QBR has a range of 1.64(J. Allen) down to -1.55(Z. Wilson)
Thus both Passer Rating and QBR show the same StDev range and characteristics as QBS. However they are murkier and more confusing in both the calculation and interpretation.
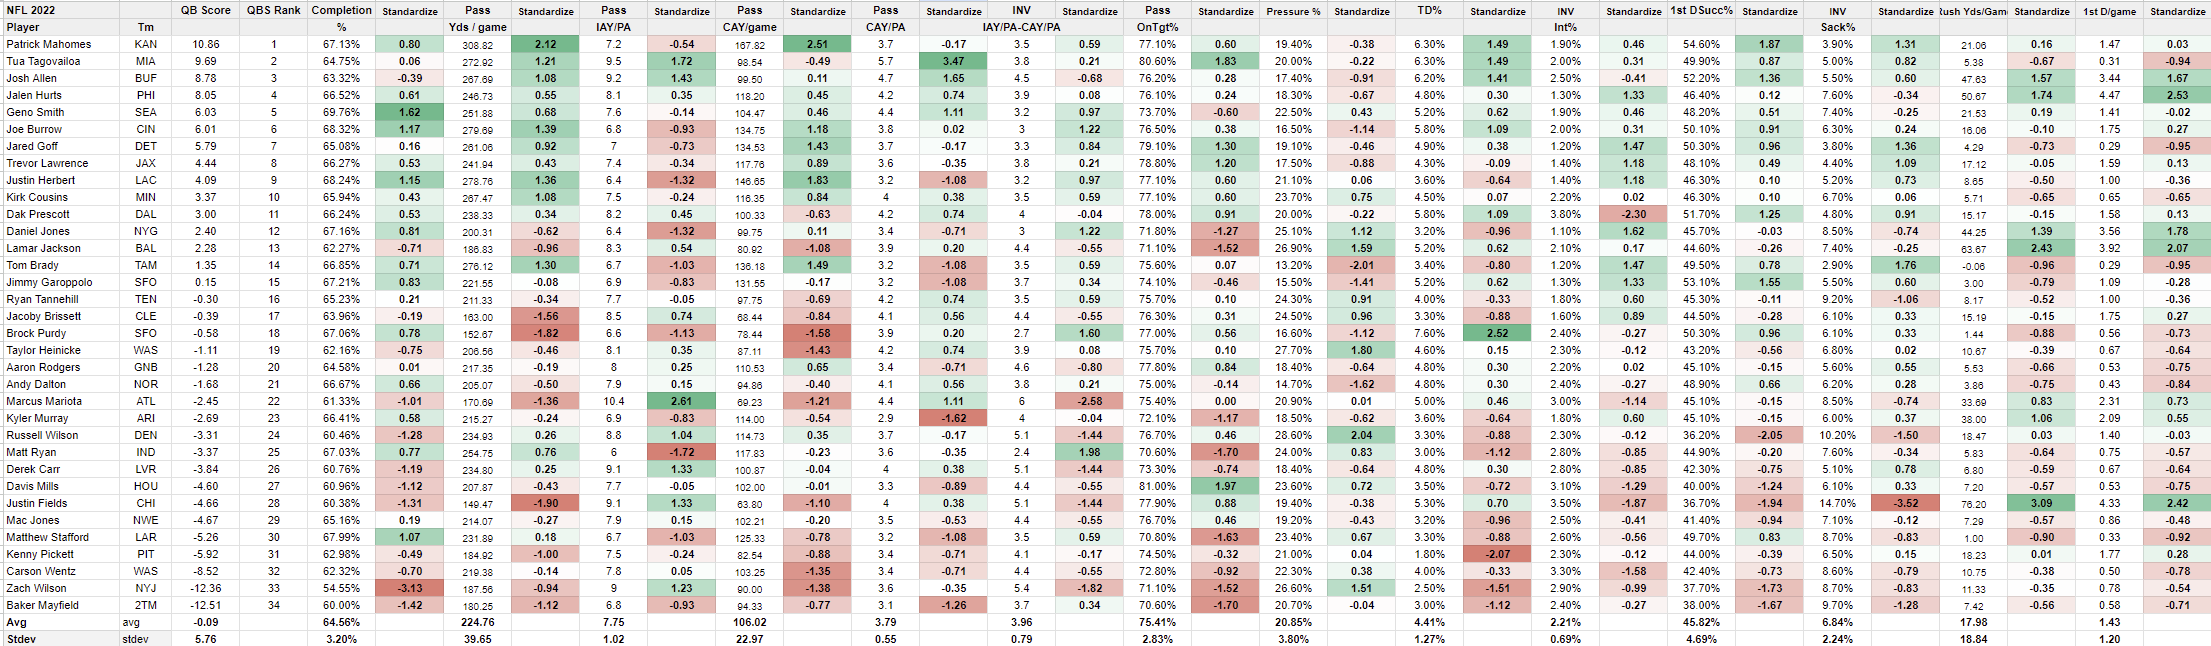
Since we are only looking at half a year stats in 2023, I ran QB Scores for both 2022 and 2021. I found it interesting that QBS has Tom Brady #1 for 2021, & Patrick Mahomes #1 for 2022. You could not find two more opposite quarterbacks in the way they play the position, but QB Score allowed each to be the best in a given season. This a sign of hope that QB Score could be a metric that allows comparison between typical pocket passers and modern mobile quarterbacks without being overally biased against either type.
QB Score – QBS – for 2022
QB Score – QBS – for 2021

As with all the ratings and analysis, feel free to chime in via the post on Reddit/r/nfl, Practicalist on Reddit, or by sending an email. Until next week, enjoy the football and best of luck to your team.
Passer Ratings Formula
The four separate calculations can be expressed in the following equations:


where
- ATT = Number of passing attempts
- CMP = Number of completions
- YDS = Passing yards
- TD = Touchdown passes
- INT = Interceptions
If the result of any calculation is greater than 2.375, it is set to 2.375. If the result is a negative number, it is set to zero.
Then, the above calculations are used to complete the passer rating:
