NFL 2024 – Team Positional Spending & Win Correlation
Here is a look at NFL team’s positional spending and whether there is any correlation between spend at a position and a winning record. This analysis is based on the 2013 – 2023 season, so 11 years worth of spend and win/loss data. All data comes from overthecap.com.
So let’s start with the big question: Is there a correlation between spending big on any specific position group and a teams’ won/loss record?
NFL Position Spend 2013 – 2024
In the chart below we can see that spend on offense in 2024 will be more than spent on the entire team in 2013, 2014, or 2015. By looking at the size of the color bars we can see there was a big spike in WR and OL spend in 2024. The complaint by running backs that they are undervalued is clear to see as their share of the pie has hardly grown at all since 2013.
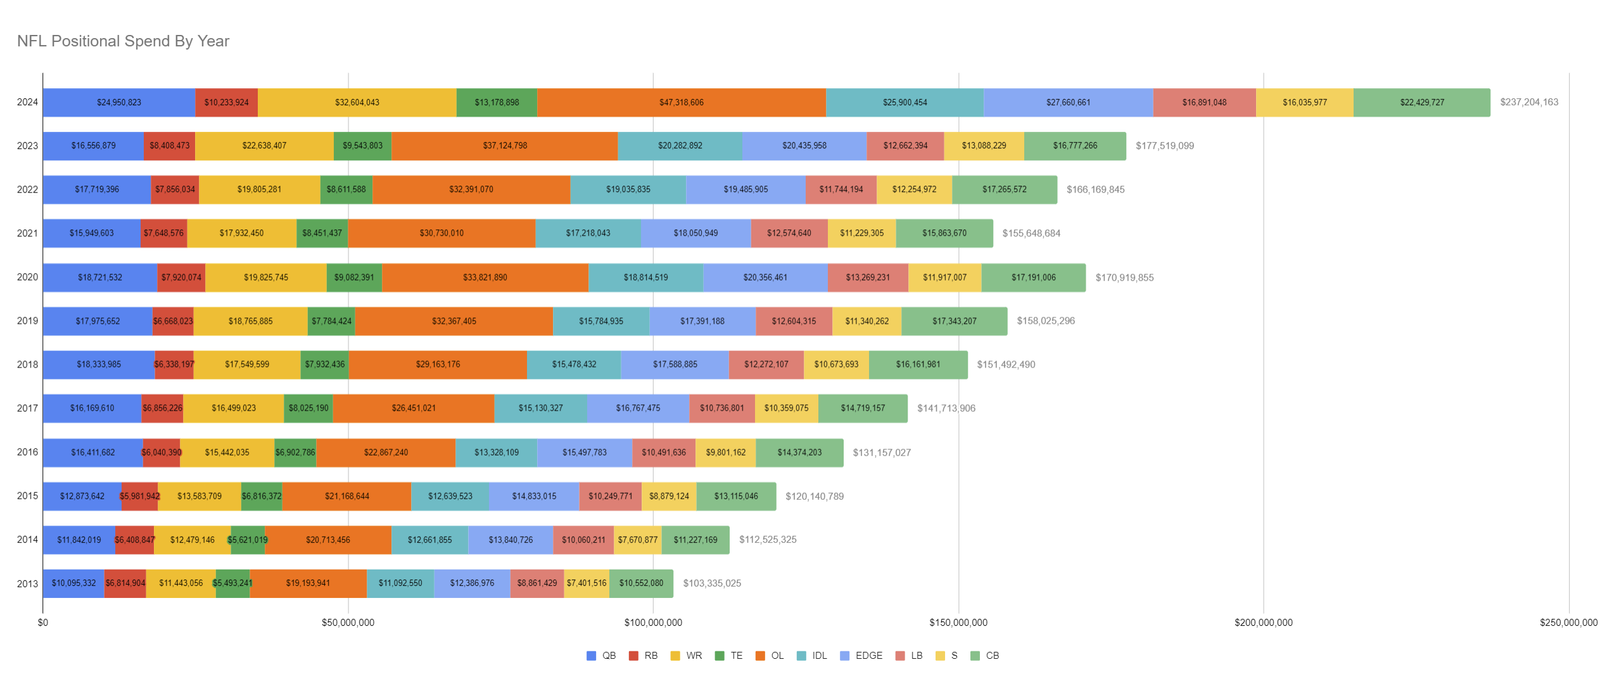
The following chart breaks down the same information by does it by position instead of year. Again you can see the huge spike in the WR and OL spend in 2024 even more clearly in this graph.

NFL Positional Spend vs Win Correlation

The chart above shows how every NFL team is spending on each position group in 2024. Offense has white text, defense has black text and black borders. The position groups and colors are at the bottom.
Top 5 Teams – Offensive Players Spend
- LA Rams – 69.85%
- Cleveland Browns – 66.43%
- Kansas City Chiefs – 66.21%
- Dallas Cowboys – 63.25
- Carolina Panthers – 62.26%
Two other teams spend over 60% on offensive players: Detroit Lions 61.83% & Miami Dolphins 60.10%
Top 5 Teams – Defensive Player Spend
- Pittsburgh Steelers – 66.77%
- Green Bay Packers – 64.11%
- LA Chargers – 58.37%
- Tennessee Titans – 56.81%
- Washington Commanders – 54.33%
Only two other teams spend more than half their salary cap on defensive players: NY Jets 53.70% & NE Patirots 53.57%.
That leaves 18 teams that spend between 50% – 60% on offensive players.
Positional Spend vs Win% Correlation
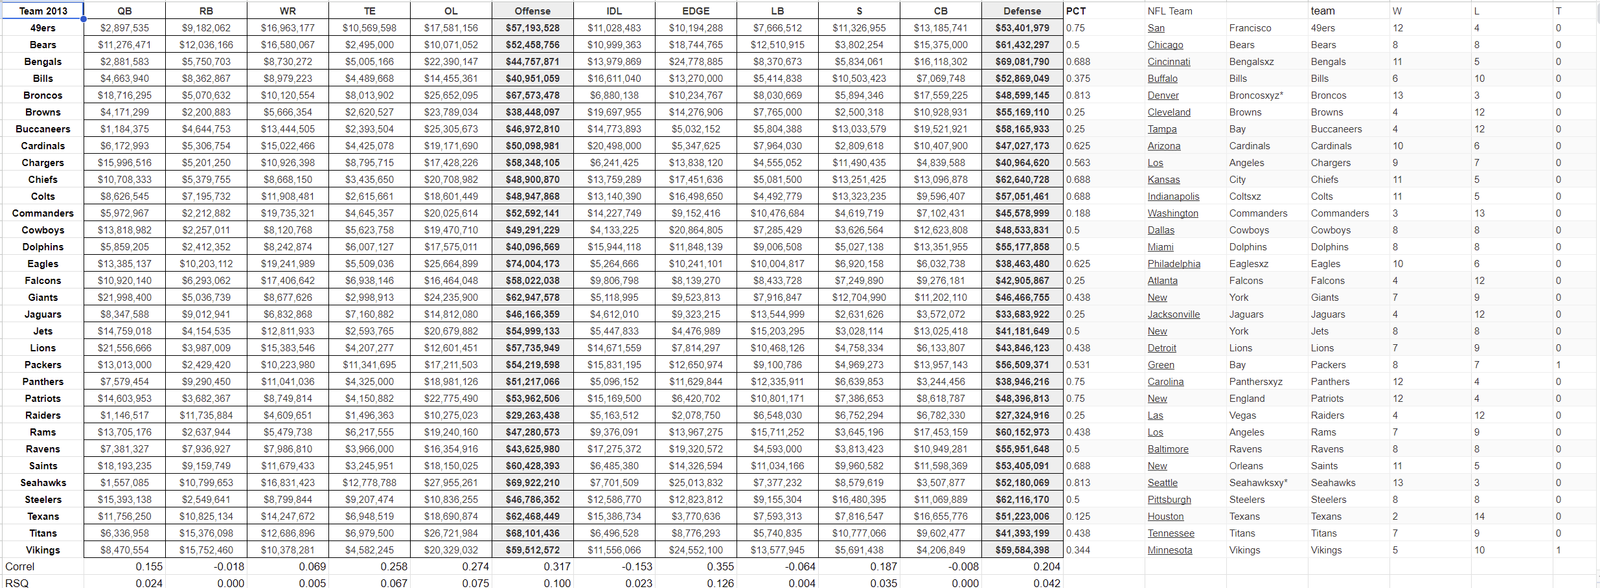
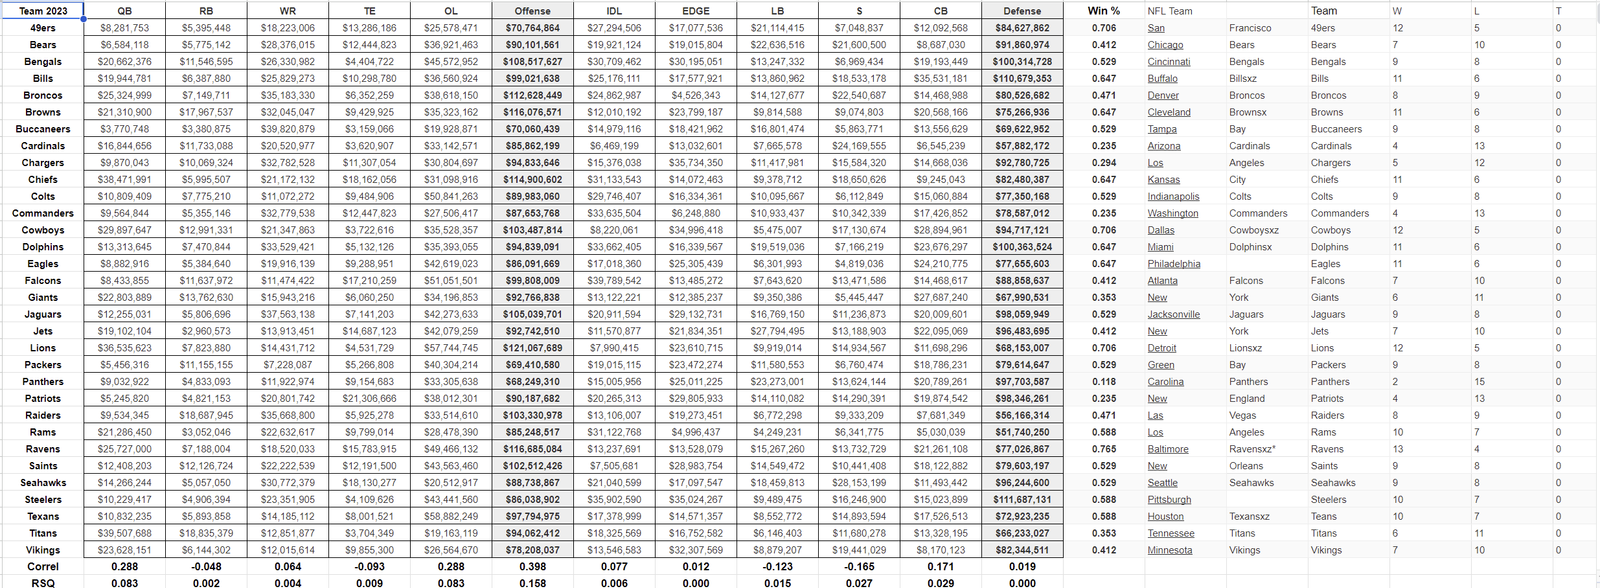
In the chart below you will see the total amount spent by all teams in 2023 broken down by position group. Also included are the amount spent on Offensive and Defensive players as group and the team’s winning % in 2023.
At the bottom you will see two additional rows:
- Correl = Correlation between amount spend and winning %.
- RSQ = R-squared value which is only really important to stat nerds in this case.

Correlation Values
Correlation is a mathematical way of comparing two sets of data to see if they trend in similar ways. Correlation values run from -1 to +1. A value of zero says there is no correlation between the two sets of data. The appear as perfectly random with nothing in common.
A value of 1 would mean perfect correlation; If a value in a cell from one set of data is high, the value of the corresponsing cell in the other data set will also be high. To achieve a +1 correlationl, every data value must correlate perfectly. In this case, the more a team spends on a position the higher the win %.
A value of -1 correlation means that the value of the corresponding cell does the exact opposite. If the first cell had a high number, the corresponding cell will have a low number. To achieve a -1 correlation, every data value must correlate exactly opposite. In this case, it would mean the more a team spends on a position, the lower the win %.
That just leaves all the values between -1 and +1 besides zero which we already noted means no correlation whatsoever. Here is a simple chart that explains the range of values and how to interpret them.
| Correlation coefficient | Correlation strength | Correlation type |
|---|---|---|
| -.7 to -1 | Very strong | Negative |
| -.5 to -.7 | Strong | Negative |
| -.3 to -.5 | Moderate | Negative |
| 0 to -.3 | Weak | Negative |
| 0 | None | Zero |
| 0 to .3 | Weak | Positive |
| .3 to .5 | Moderate | Positive |
| .5 to .7 | Strong | Positive |
| .7 to 1 | Very strong | Positive |
2023 Positional Spend vs Win % Correlation
In 2023 the highest correlation with Win % was amount spent on Offensive players(0.398). Spend on Defensive players as a group had almost nor correlation whatsoever with Win % (0.019). By position group the rankings:
- Quarterback & Offensive Line (0.288) TIE
- Cornerback (0.171)
- Interior Defensive Line (0.077)
- Wide Receiver (0.064)
- Edge (0.012)
- Running Back (-0.048)
- Tight End (-0.093)
- Linebacker (-0.123)
- Safety (-0.166)
In 2023 there was moderate correlation between Win % and spend on Offensive Players, Quarterbacks, & Offensive Lineman. If a team invested in these position groups in 2023, they had winning seasons on average..
The converse of this, is that in 2023 teams that spent heavily on Safety & Linebackers tended to have below average seasons. The negative correlation on these positions was not as strong as the Offensive, QB & OL positive correlations, but they do register in the middle of the weak influence area.
2013 – 2023 NFL Position Spend vs Win %
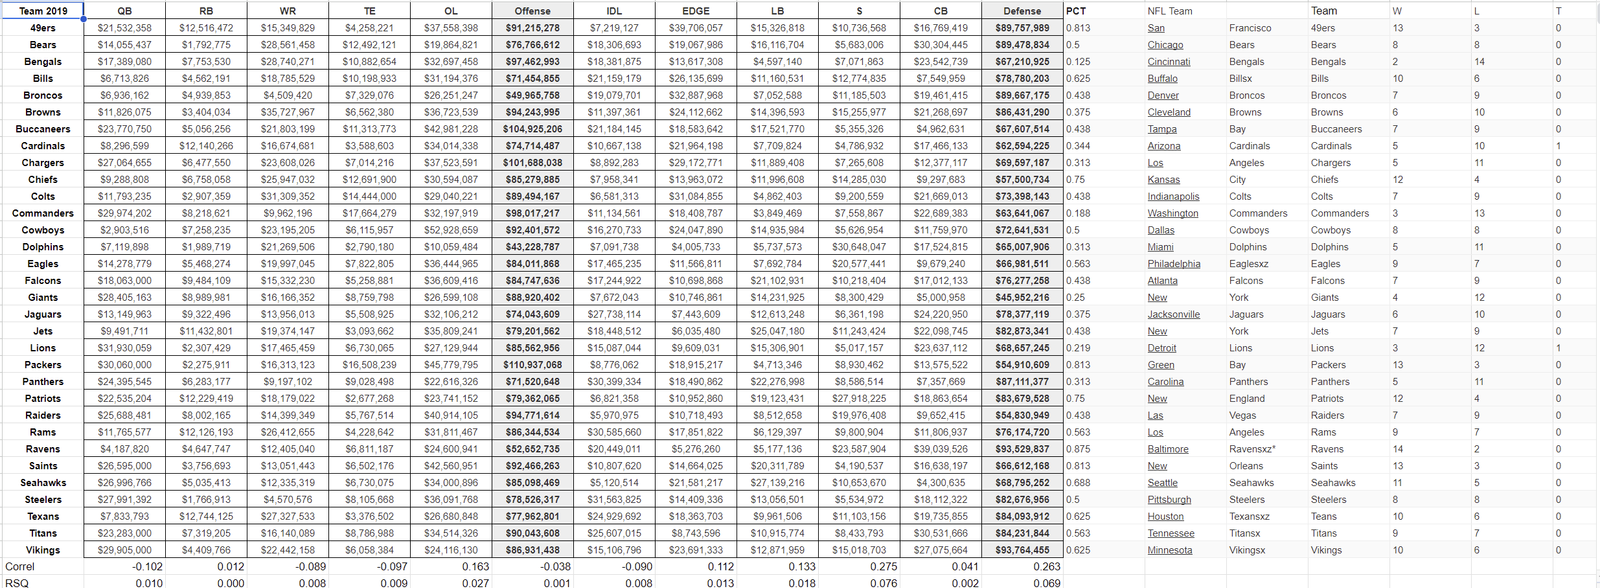
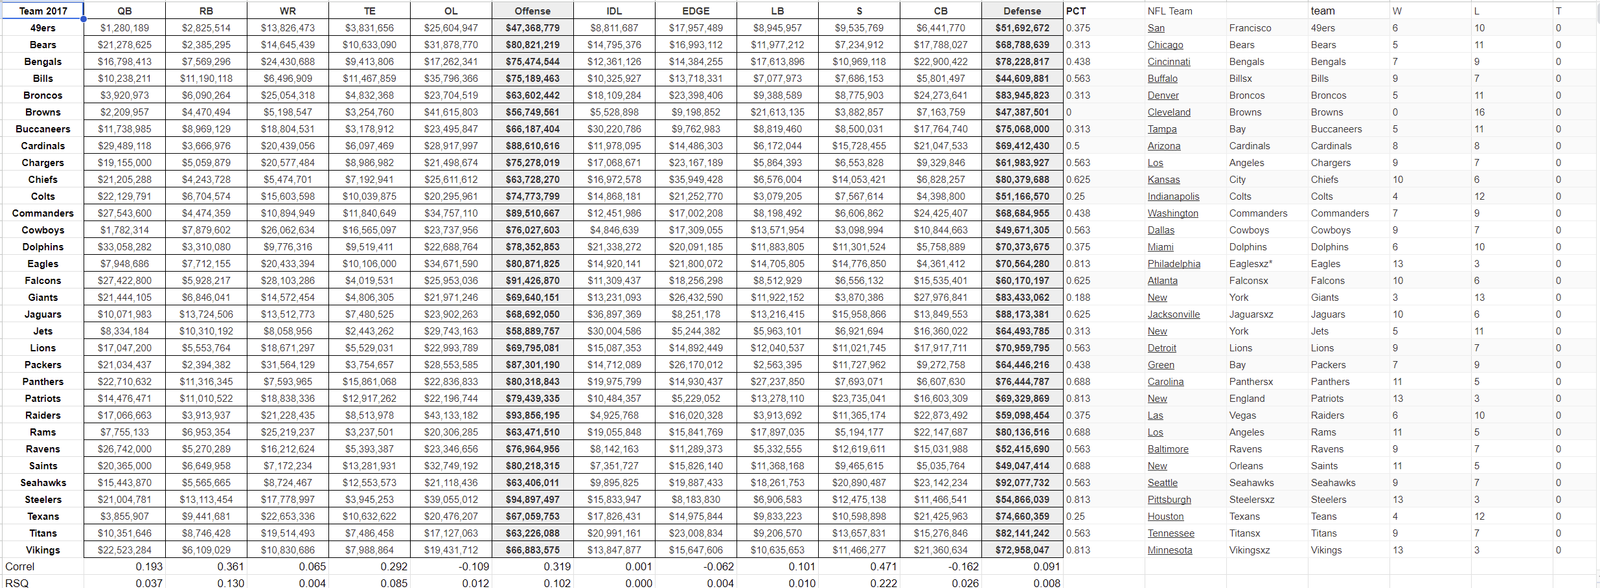
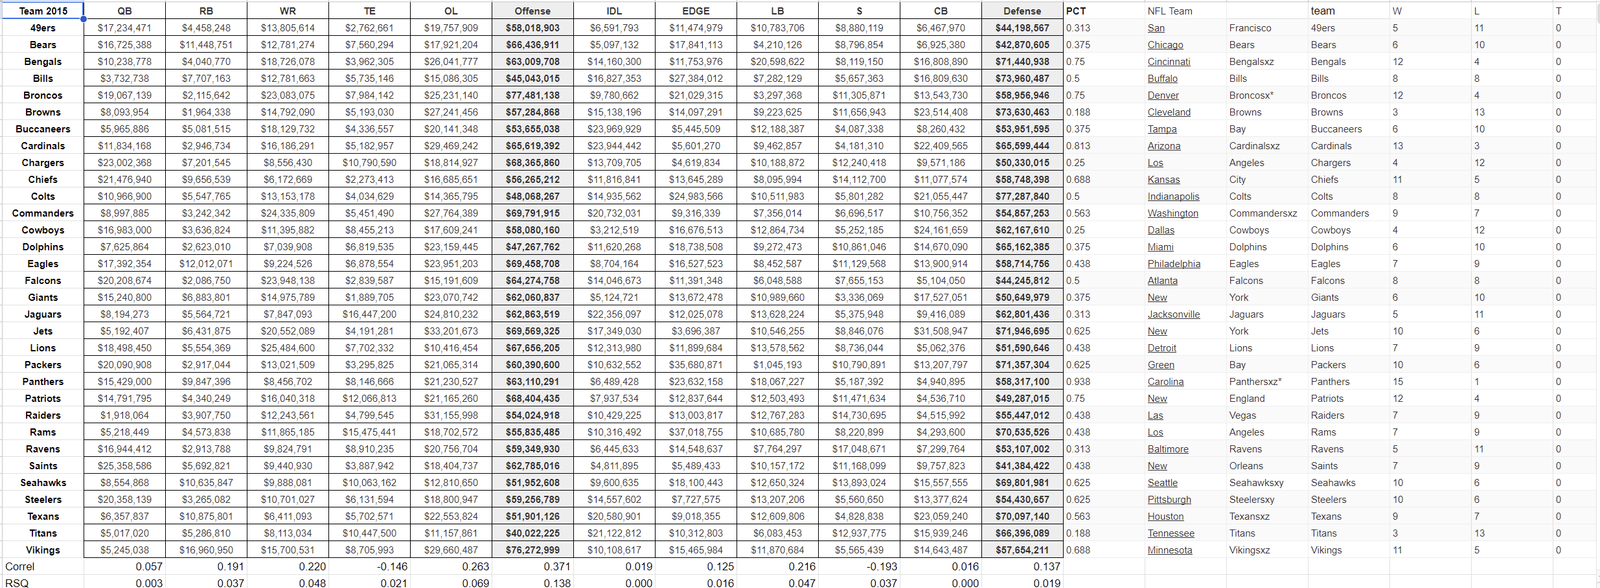
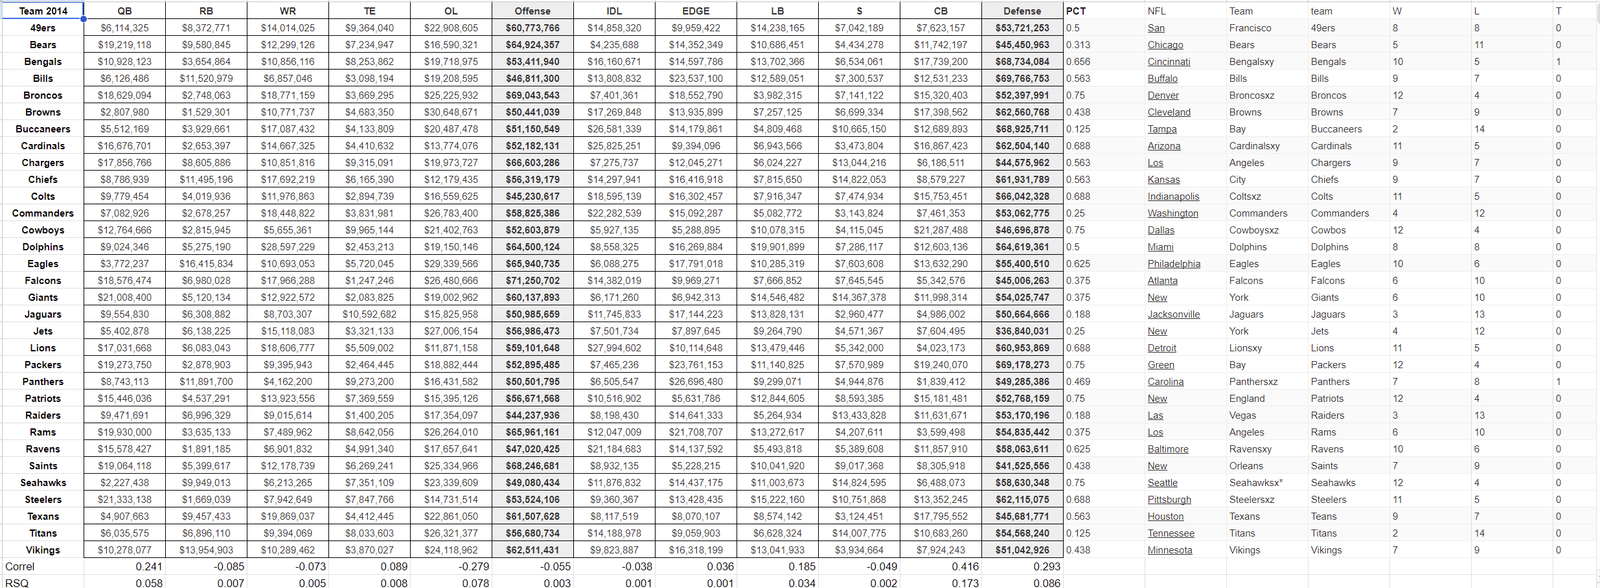
I will post all the individual year data at the end of the article, but for now let’s move on to a chart that summarizes the last 11 seasons’ positional spend vs Win % correlation. In the chart below each year is a row, and each position is a colum. The correlation value is show for each position in every year.
In addition to the correlation values, at the bottom of the chart you will see the following rows:
- AVG = Average correlation for the position over the past 11 seasons.
- MEDIAN = The median value for each position over the past 11 seasons
- High = The highest correlation value for the position from 2013 – 2023
- Low = The lowest correlation value for the position from 2013 – 2023
- Pos Correl Years = Amount of years the position had a positive correlation with Win %
- Neg Correl Years = Amount of years the position had a negative correlation with Win %
- Pos Correl % = Pos Correl years / Negative Correl Years
- 0.2+ = % of years the positon had a correl of 0.20 or higher
- 0.3+ = % of years the positon had a correl of 0.30 or higher
- 0.4+ = % of years the positon had a correl of 0.40 or higher

Some interesting takeaways:
- The amount spent on Defensive players as a group had positive correlation in all 11 years.
- The amount spent on Edge players had a positive correlation in 10 out of 11 seasons.
- The amount spend on QBs had a positive correlation in 9 out of 11 seasons. No real surpise here.
- WR, TE, OL, Offense, LB, & Safety all had positive correlation 8 out of 11 seasons.
- RB, IDL, & CB had positive correlation in only 6 of 11 seasons.
- The amount teams spend on offensive players as a group and defensive players in a group has the strongest average correlation over the eleven seasons with both at just over (0.20)
- Edge is the position with the highest average correlation at 0.191. QBs at 2nd at 0.142 & Safeties 3rd at 0.122.
- Interior Defensive Lineman are the only position group to average a negative correlation over 11 seasons (-0.013).
- There were 3 occurances of a position having a positive correlation of over 0.40:
- Defensive Player spend in 2020 (0.416)
- Safety spend in 2017 (0.471)
- CB spend in 2014 (0.416)
- There 3 were occurances of a position having a negative correlation worse than -0.25:
- RBs in 2018 at -0.254
- IDL is 2016 at -0.315
- OL in 2014 at -0.279
- The amount spent on Offensive players or Defensive players as a group has the highest correlation with Win %
- Spend on Offensive players has had a correlation of greater than 0.30 in 6 of 11 season & 0.20+ in 7 seasons.
- Spend on Defensive players has had a correlation if greater than 0.20 in 7 of 11 seasons.
- Edge spend has had a positive correlation of 0.30+ in 5 of 11 seasons.
2024 NFL Team Positional Spend
The four charts below show how much each NFL team is spending on each position in 2024. There are 4 charts to analyze:
- Team Positional Spend – This breaks down the positional spend each team has commited to in 2024.
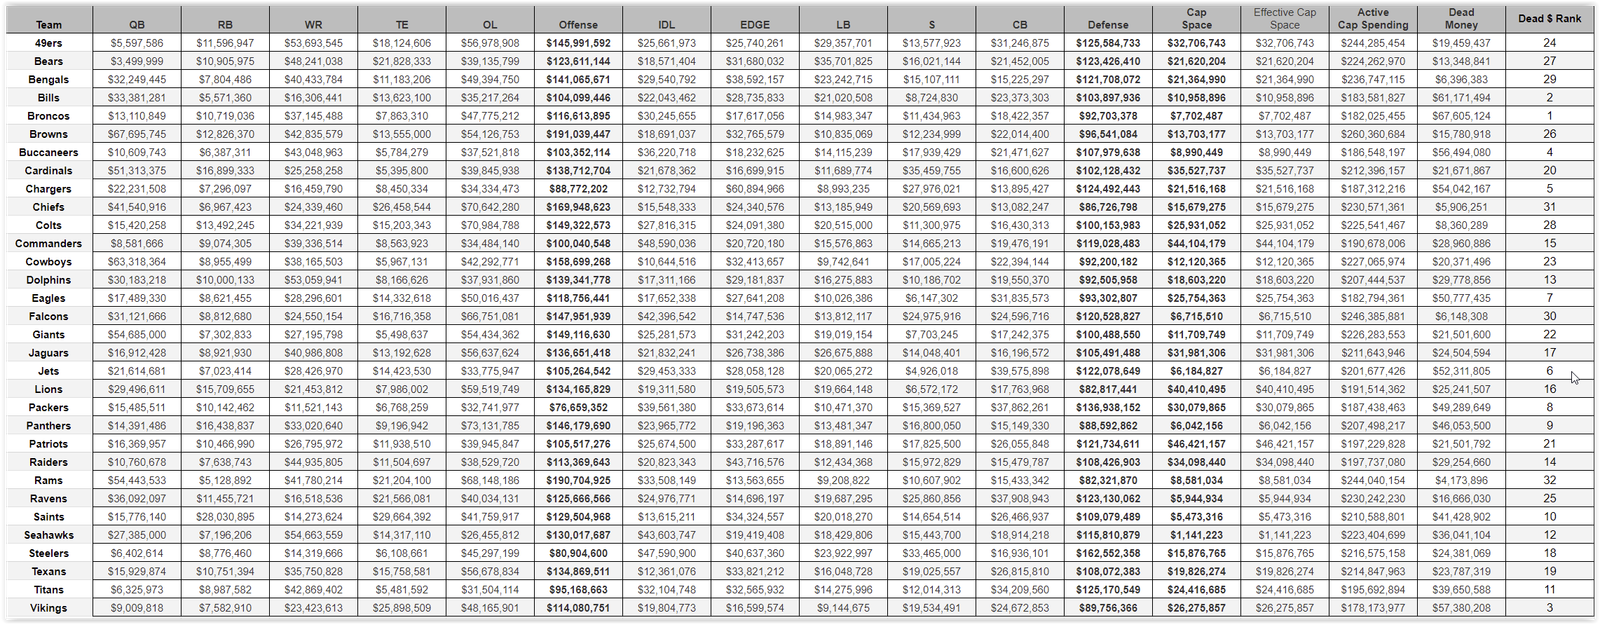
- Team Positional Spend Ranks – This shows the ranking of each teams’ spend in each position group.
- Team Positional Spend % – This shows the pecentage of the cap each team is spending on each position group.
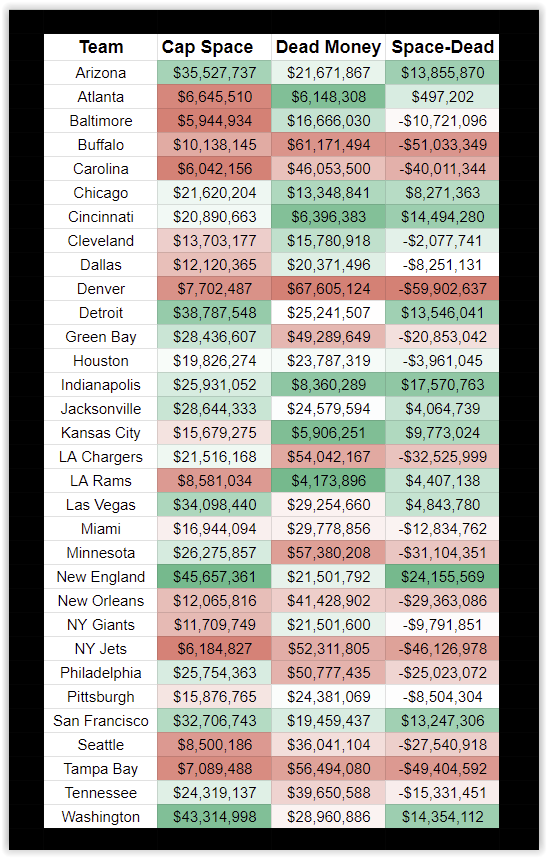
- Cap Space vs Dead Money – A simple chart showing each teams’ cap space, dead money and cap – dead value. The last value is a bit of an indicator on whether a team’s cap management is working for them or against them this year.
2024 NFL Team Positional Spend Ranks

2024 Salary Cap Evaluator
The interesting part of this chart are the two columns in blue. I tried to create an algorithm that would grade teams on where they are spending their money in 2024 based on the positional win % correlation we saw over the 11 seasons from 2013 -2023.
In the chart below you can see the methodology. I took the avg and stdev of the correlation values of all the positions and then normalized each position’s correlation value. This value was multiplied by 10 to give the weight for each position.
Each position value was then multiplied by the team’s rank for spend in that position. So they team that spent the most on Offensive players as a group gets a score of 9.41 * 1 = 9.41 and the team that scores 32nd get a score of 32 * 9.41 = 301.12.
If we do this for evert team rank and position group we will get a final value for each team. In this case, the lower the value, the more likely that the positional spend the team has commited to in 2024 will lead to a winning season.
Please note that this algorithm DOES NOT take into consideration the quality of the player(s) a team spent on, only the amount and the position. A team could spent significantly on Edge players who stink, in which case the algorithm would be “tricked” into ranking the team higher in the rankings since the spend was in a correlated position.

The 5 teams with the lowest scores and therefore the highest chance at a winning season:
- Cincinnati Bengals
- Cleveland Browns
- Houston Texans
- San Francisco 49ers
- Atlanta Falcons
Teams on this list would seem to be putting their money into the right positions and minimizing dead money. Teams like the Cheifs (10th) & Colts (17th) have almost no dead money charge so that means their low ranking is based primarily on positional spend allocation(they are spending on positions not likely to correlate with winning).
My guess is Atlanta jumped onto the list with the signing of Cousins & high TE/OL spend. In 2023 the Falcons spent $8m on QB and $88m on Offense. For 2024, they are spending $31m on QB & $147m on Offense.
The 5 teams with the highest scores and therefore the highest chance of a losing season:
- Denver Broncos
- Tampa Bay Buccanneers
- Minnesota Vikings
- Detroit Lions
- Washington Commanders
Teams on this list most likely have high dead money charges and they are putting money into low correlation positions.
Detroit is the one real surprise on the list, but they do have a $25m dead money charge in 2024, and they spend on positions with low win% correlation. The Lions may be a perfect example of how the algorithm could be tricked by a team that spends on less correlated positions, but has highly skilled players.
2024 NFL Team Positional Spend %

2024 NFL Team Cap Space vs Dead Money
Positional Spend vs Win% Correlation By Year
2023 Positional Spend vs Win % Correlation
2022 Positional Spend vs Win % Correlation

2021 Positional Spend vs Win % Correlation

2020 Positional Spend vs Win % Correlation

2019 Positional Spend vs Win % Correlation
2018 Positional Spend vs Win % Correlation

2017 Positional Spend vs Win % Correlation
2016 Positional Spend vs Win % Correlation

2015 Positional Spend vs Win % Correlation
2014 Positional Spend vs Win % Correlation
2013 Positional Spend vs Win % Correlation
