NFL Power Ratings & Rankings Charts
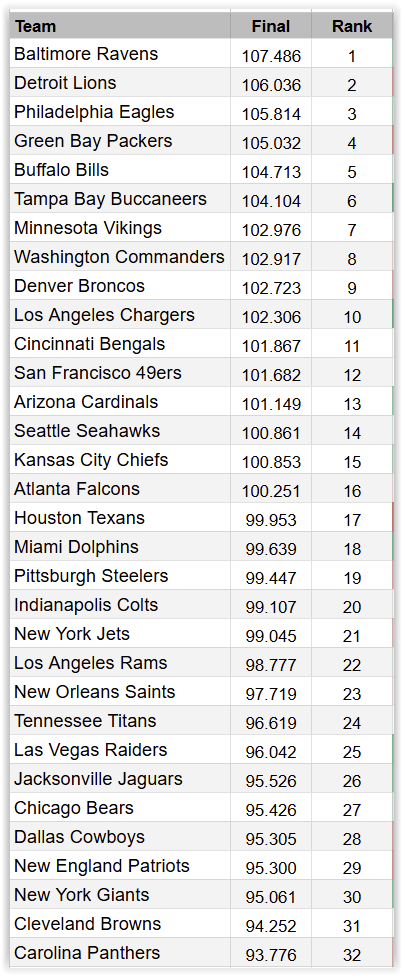
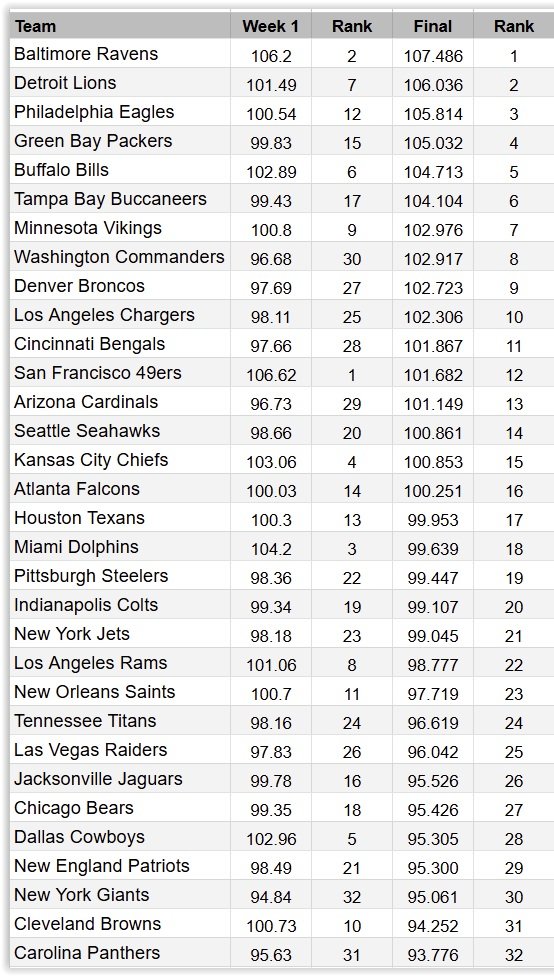
Weekly NFL Power Ratings & Ranking data for all 32 teamsEvery week nfllines.com calculates NFL power ratings for every team. These ratings are used to compare teams and calculate a point spread. This calculated point spread is compared to the Vegas point spread and predictions are made based on the perceived line error. You can also find each team’s power rating/ranking & movement on the weekly picks sheet.
NFL 2024 FINAL Power Ratings & Rankings
Weekly NFL Power Ratings & Ranking data for all 32 teams2024 Team Win Projections
NFL 2023 Power Ratings & Rankings
NFL Power Ratings
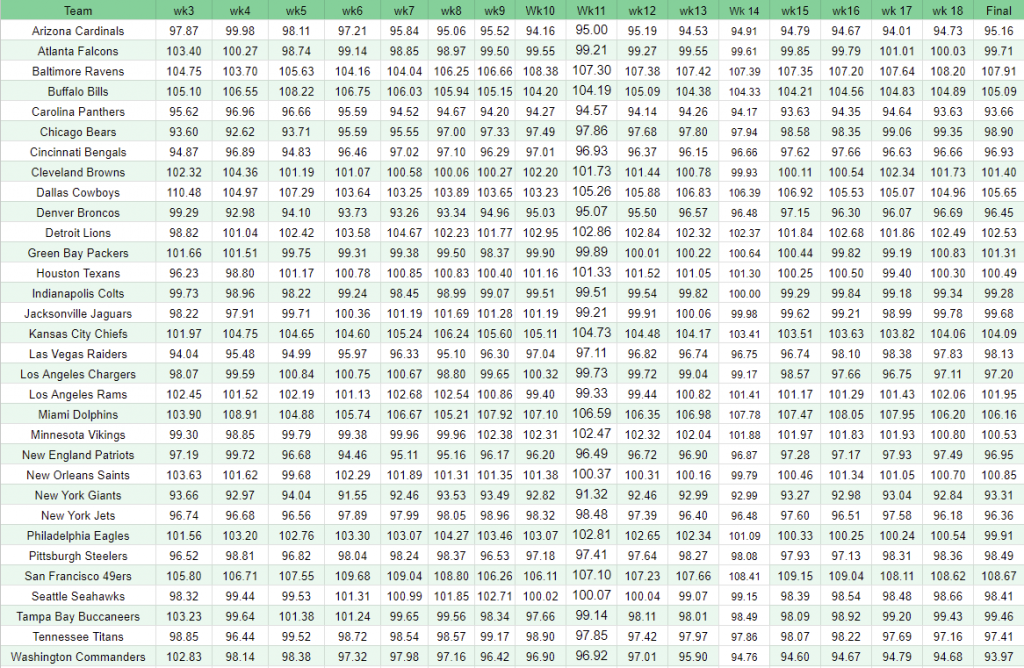
Ratings for all 32 NFL Teams where 100 is an average team.The NFL team power ratings allows comparisons between teams for prediction purposes. The average team is set at 100. Typically playoff teams will have a power rating above 100, while eliminated teams are most likely under 100.
The range of the Power Ratings is currently set to 14-17 points. This allows for up to 20 point spreads when a dominant team at home meets a hapless team traveling to play them. Rarely do NFL lines get above 16-17 points, thus the need for a cap even if the predicted spread were to be higher.
The graph below shows the range of the power ratings for each team over the course of the season thus far. Thus should allow you to feel confident about a power rating range a team is capable of on a typical week. Please remember, all NFL team will probably come out flat 1 or 2 times during the season and produce an atypical performance. As a handicapper, you just need to evaluate if it was a one off dud, or the beginning of a trend.
Archives
NFL 2023 Week 6 Power Ratings Chart
NFL 2023 Week 7 Power Ratings Chart
NFL 2023 Week 8 Power Ratings Chart
NFL 2023 Week 9 Power Ratings Chart
NFL 2023 Week 10 Power Ratings Chart
NFL 2023 Week 11 Power Ratings Chart
NFL 2023 Week 12 Power Ratings Chart
NFL 2023 Week 13 Power Ratings Chart
NFL 2023 Week 14 Power Ratings Chart
NFL 2023 Week 15 Power Ratings Chart
NFL 2023 Week 16 Power Ratings Chart
NFL 2023 Week 17 Power Ratings Chart
NFL 2023 Week 18 Power Ratings Chart
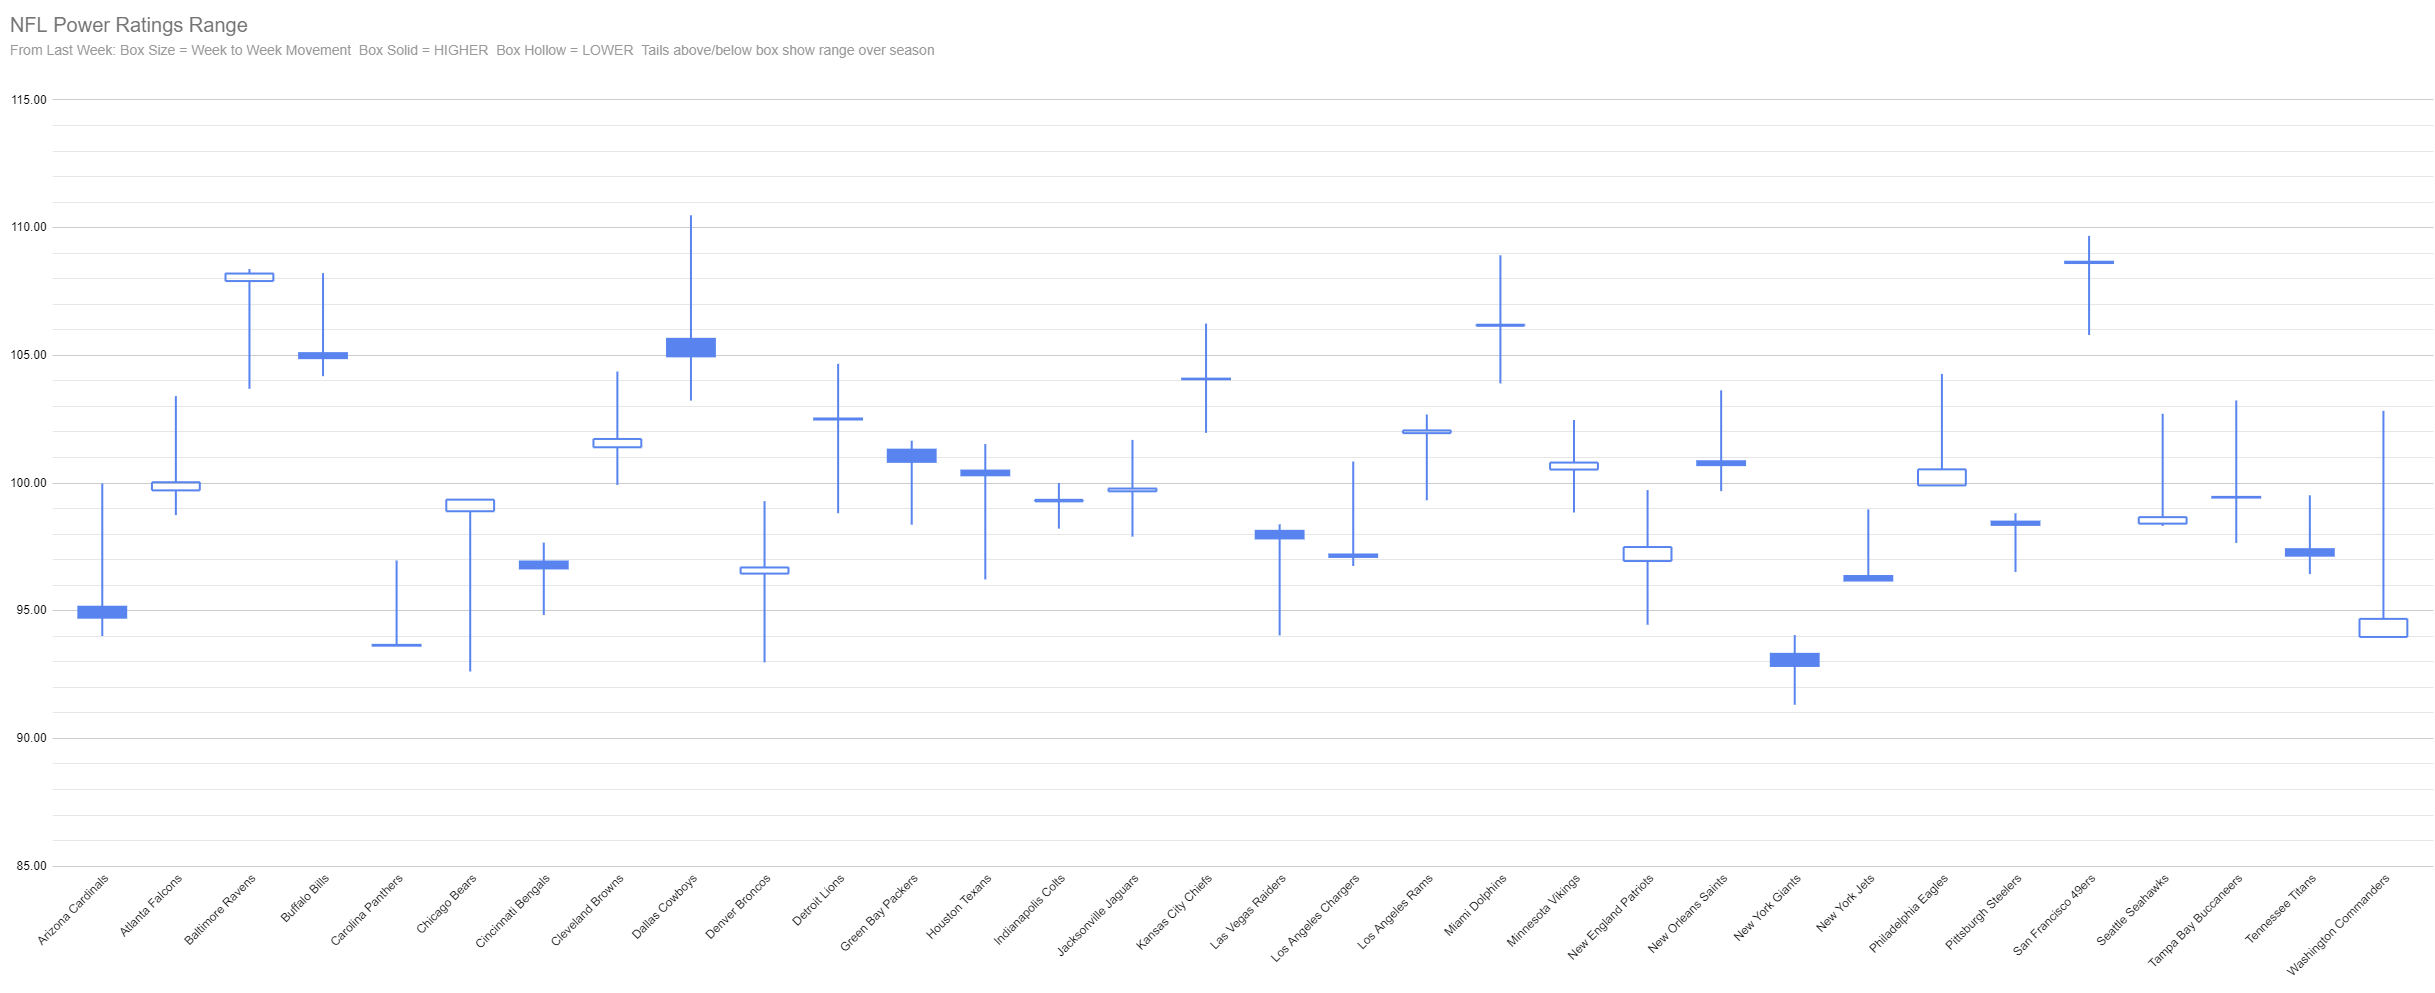
Above is a candlestick graph, typically used for stocks, to represent NFL team power ratings.
-
The size of the box shows the movement week to week.
-
A solid box represents a higher rating week over week, while a hollow represents a lower rating.
-
The tails above and below the box show the team’s power rating range represented by their highest rating and lowest rating thus far during the season.
Whiskers/Tails:
-
Longer whiskers equals less consistent, particularly if both above and below.
-
No whiskers – If box is small, extremely consistent. If box is large, team has consistantly been rated within the range of the box.
-
Long whiskers above means the team had a much higher rating at one time but are now near their nadir.
-
Conversely a long whisker below means the team was once rated very low but now is rated much higher.
- Similarly, a team with no bottom tail is at their lowest rating currently.
A team with no tails at all means that they are at their highest or lowest rating
AND that those rating were in the past two weeks
AND all other power ratings for the team fell between this week and the previous week’s power rating.
A solid no tail box means a team has reached their highest power rating.|
NFL Power Rankings
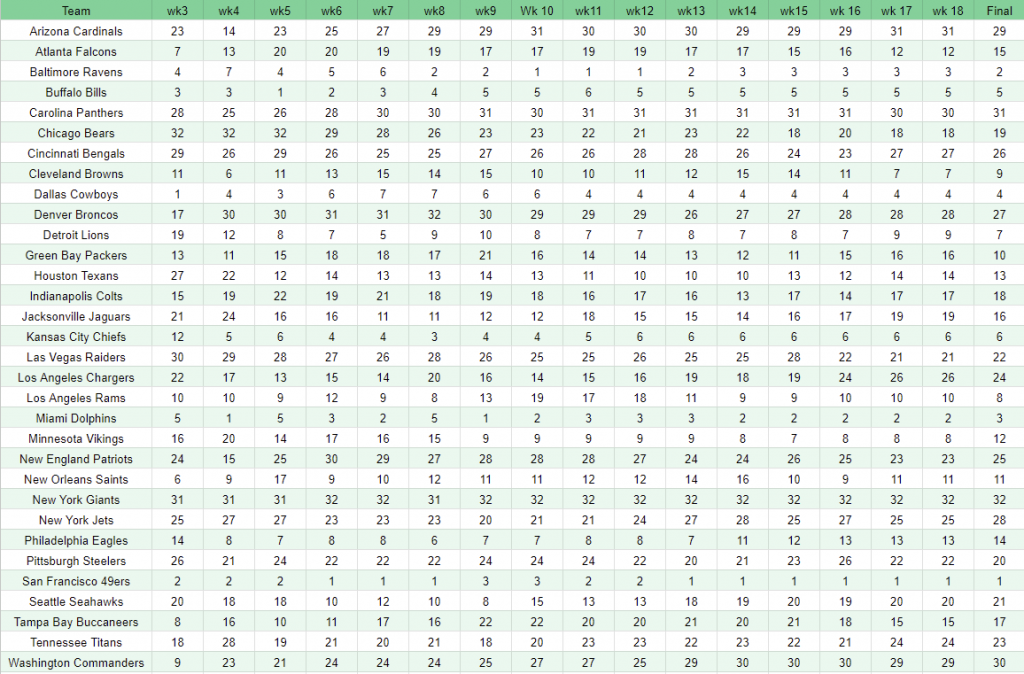
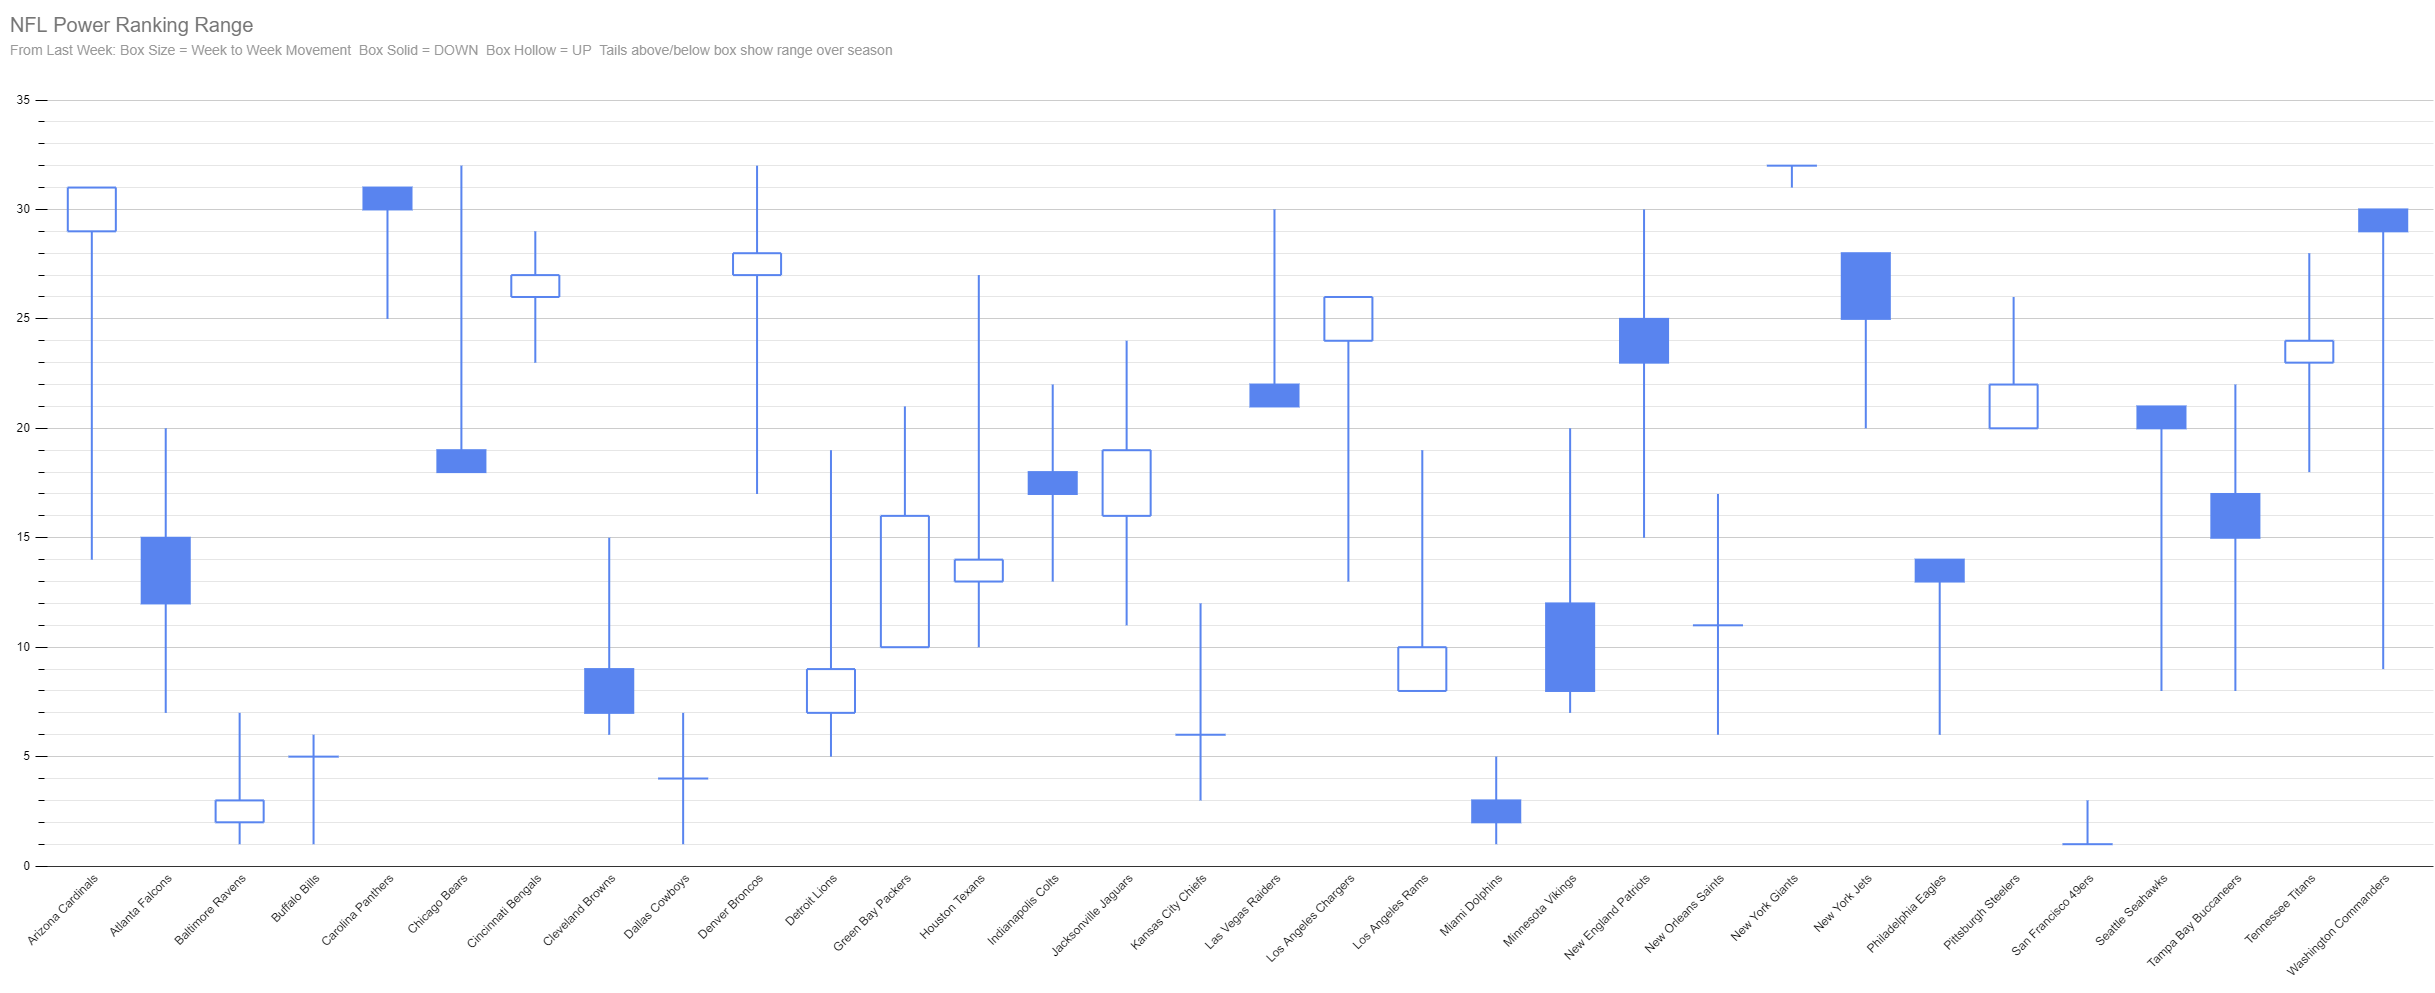
Aggregate Power Rankings, 1 thru 32, for all 32 NFL Teams based on their weekly Power RatingsThe NFL Power Rankings graph simply shows the range of ranks between 1 -32 each team has been in each week in regards to the Power Ratings.
Rankings will refer to the range of 1 – 32, Ratings will be the value that ranges between 90 -110 in most cases.
You cannot use ranking to calculate spreads or make informed decisions. Please use the Power Ratings for this purpose.
Archives
NFL 2023 Week 6 Power Ranking Chart
NFL 2023 Week 7 Power Rankings Chart
NFL 2023 Week 8 Power Rankings Chart
NFL 2023 Week 9 Power Rankings Chart
NFL 2023 Week 10 Power Rankings Chart
NFL 2023 Week 11 Power Rankings Chart
NFL 2023 Week 12 Power Rankings Chart
NFL 2023 Week 13 Power Rankings Chart
NFL 2023 Week 14 Power Rankings Chart
NFL 2023 Week 15 Power Rankings Chart
NFL 2023 Week 16 Power Rankings Chart
NFL 2023 Week 17 Power Rankings Chart
NFL 2023 Week 18 Power Rankings Chart
I am raw html block.
Click edit button to change this html


