
NFL 2023 Quarterback Ratings: QB Score vs Passer Rating vs QBR
QB Score was created earlier this season in an attempt to create a QB rating system that would somehow account for the unique talents that players like Jackson, Hurts, Allen, Mahomes, and other hybrid quarterback bring to the field outside pure passing.
This is the third iteration of QB score and it makes for very interesting MVP talk. There have beena few tweaks to the metrics, but essentially it is very similar to the last published rankings after week 9.
Why QB Score?
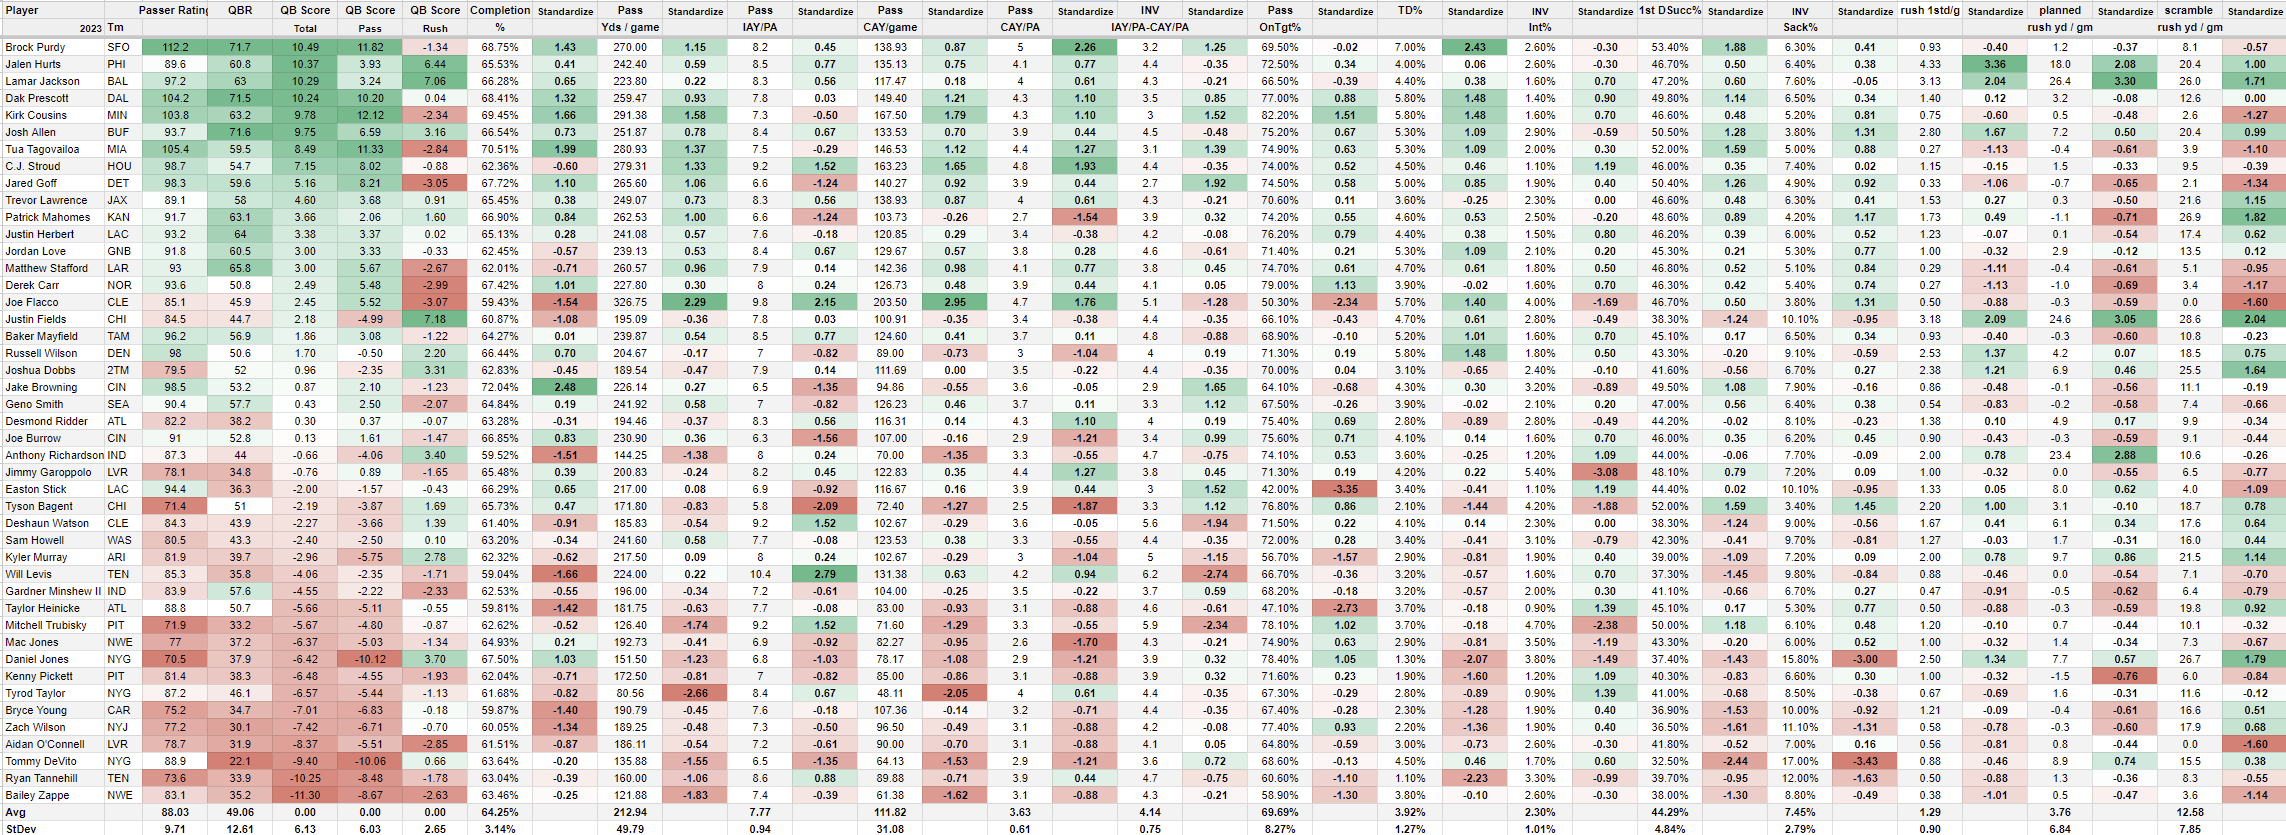
QB Score, QBS, is derived from comparing the stats of all quarterbacks to each other and then scoring each QB in 14 categories. To do the scoring, QBS uses Standard Deviation units. Essentially the better a QB is compared to all his fellow QBs in that metric, the higher the score he receives for that metric.
The most recent QB Score article before this: QB Score v2.0 – QBS – Comparative NFL Quarterback Ratings
The argument for using QBS is pretty clear:
- It is the most intuitive of the QB rating scales with an average of virtual zero and the smallest range.
- QBS is the easiest QB rating metric to calculate
- QBS is the only comparative QB rating system that takes into account the QB’s performance compared to their peers.
- Quantifying the QBS score to a descriptive adjective on the QB play is simplest due the inherent ranges in its scoring system.
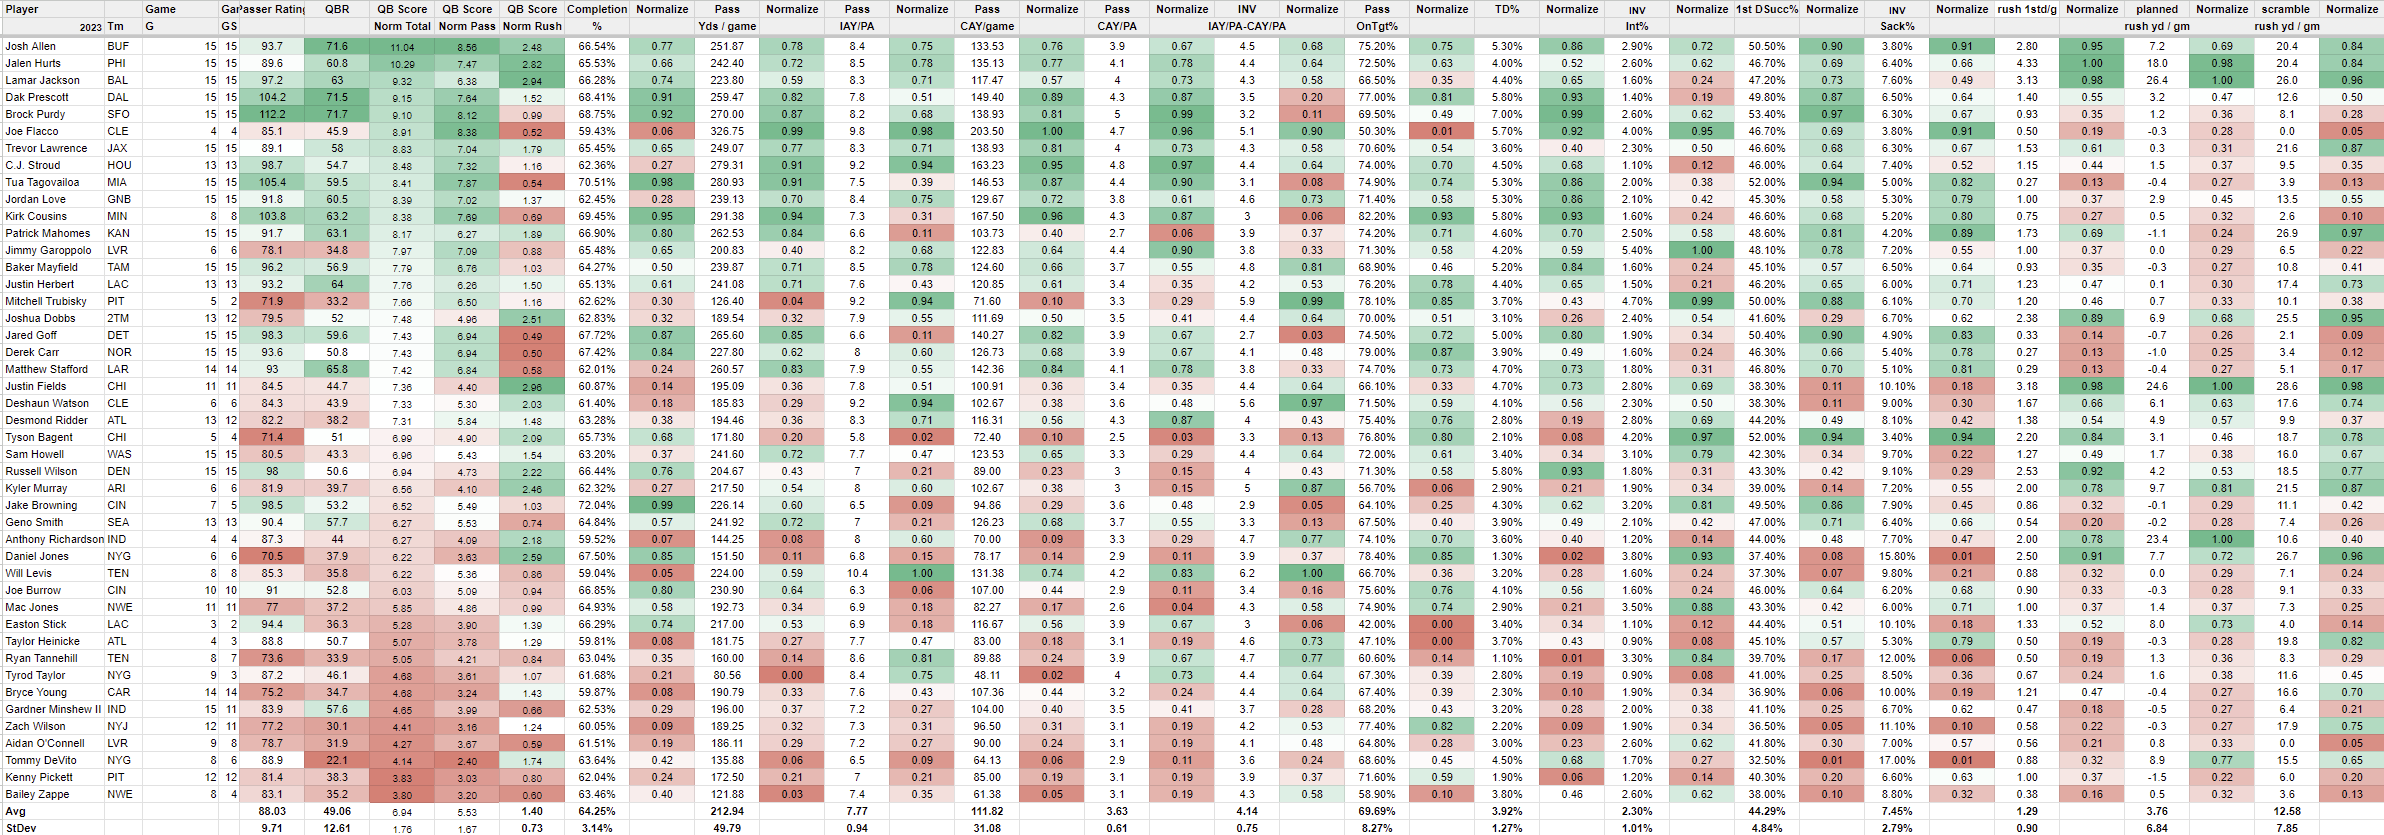
QB Score Metrics
Here are the metrics for calculating QBS. All NFL QBs are scored in 14 statistics:
- Completion %
- Passing Yards / Game
- Intended Air Yards / Pass Attempt
- Completed Air Yards / Game
- Completed Air Yards / Pass Attempt
- Intended Air Yards/ Pass Attempt – Completed Air Yards / Pass Attempt (Inverse)
- On Target %
- Touchdown %
- Interception % (Inverse)
- 1st Down Success %
- Sack % (Inverse)
- Rushing 1st Downs
- Planned Rushing Yardage per game
- Scramble Rushing Yardage per game
You’ll notice that 3 statistics have (Inverse) next to them. This simply means when calculating, a lower value is better. It is better to have a low INT% and Sack% so the stat/score is inverted. At the bottom of every metric you can see the average and the size of 1 unit SD range.
Intended Air Yards – The Gunslinger Metric
Every metric you see above you may have seen before or know already with the exception of two: the metrics involving Intended Air Yards. First, Intended Air Yards is simply the measure of how far the QB threw the ball on all attempts, whether complete, or incomplete.
For example, a QB attempts a 10 yard pass but it is incomplete. Intended Air Yards is 10, but Completed Air Yards is zero. If the pass was complete and the receiver ran for 6 yards after the catch: Intended Air Yards is 10, Completed Air Yards is 10, YAC is 6, and Passing Yards are 16.
I am calling this the Gunslinger metric, and here is why it is included. Ideally you would love to have a QB willing, and able, to push the ball downfield. So let’s reward the ones who do in QBS. All other metrics being equal, we would love it if our QB threw for 9 intended air yards every attempt as opposed to 6, because all other things being equal(including completion %), we would move down the field faster.
But all other things are not equal…Completion % decreases as intended air yards increase(its harder to complete a longer pass than a shorter one in most cases). The ball literally takes longer to travel 9 yards as opposed to 6 yards giving defense more time to react. Most importantly, most NFL defenses are set up to minimize long pass completions in exchange for shorter ones. So a gunslinger QB who is always trying to go deep needs to be kept in check in QBS by making sure they are not just flinging it willy nilly downfield.
The way this is done is with the second metric, (Intended Air Yards / PA – Completed Air Yards / PA), a metric I made up. I call this metric, The Take What The Defense Is Giving You Metric. This is how it works…By taking IAY/PA and subtracting CAY/PA we are seeing if the QB is trying to go deep too often. Essentially, NOT taking what the defense gives them. Typically QBs who score high in IAY score low in IAY – CAY. Only the prudent quarterback who goes long only when necessary and open will excel at both metrics.
Quarterback Types
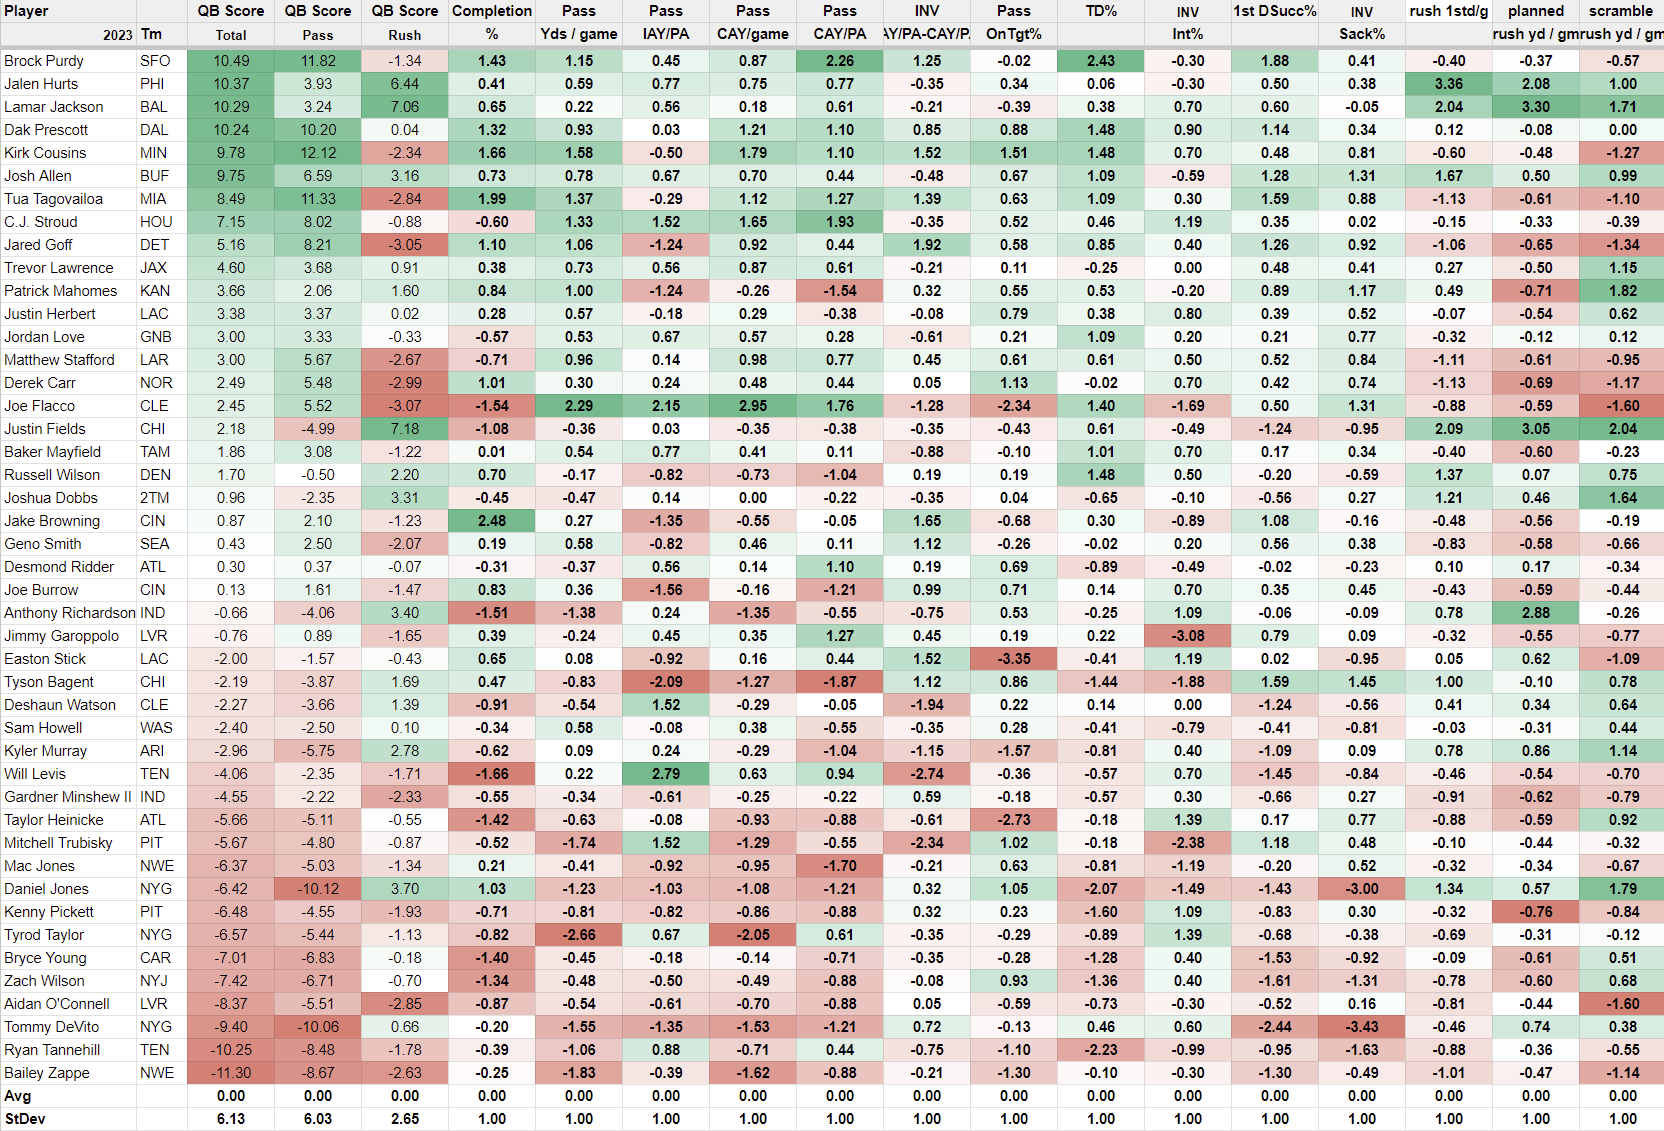
QB Score has two components Pass Score and Rush Score; the sum is QB Score. Breaking out pass & rush scores really help identify and classify QBs into a handful of types.
Pocket Passer – Will have high Pass Score and negative or average Rush score. Purdy, Tagovoiloa, Cousins, Goff are all this type.
Hybrid Passer – Will have mid range Pass and Rush Scores but pass will be relatively higher. Prescott, Lawrence, Love would be this type of QB.
Hybrid Rusher – Will have a higher Rush score than pass score, though pass score will still be well above average. Hurts & Jackson are the prototype for this group.
Pure Hybrid – This is a quarter back with both high pass and rush scores. Josh Allen and Patrick Mahomes(in a normal season for him) would be this type of unqualified hybrid.
Cagey Veterans – These guys usually have above average pass scores and fairly negative rush scores as age starts to limit their mobility. Stafford, Carr, Flacco, Mayfield, Geno Smith all fall into this category.
Run Around & Chuck It – These quarterbacks will have negative pass scores and positive rush scores. Fields, Richardson, Murray, Watson, Dobbs all are in this group.
Walking Timebombs – This last group are the quarterbacks with both negative pass and rush scores, many with quite negative efforts in both categories. O’Connell, Zappe, M Jones, etc. Some will have a modicum of rush ability but then even worse pass scores like DeVito, D Jones, Z Wilson, B Young.
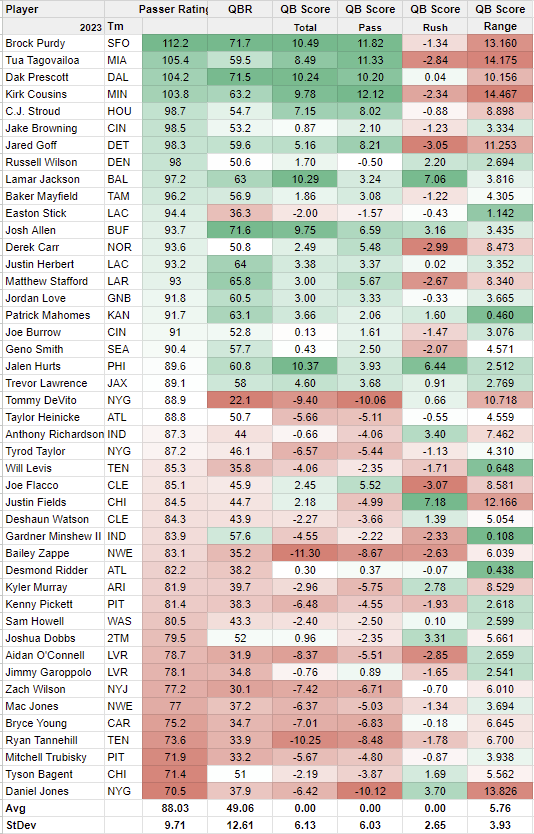
The Quarterback Tiers
This is based on this season’s stats with this group of quarterbacks compared to each other. It is only looking at performance from 2023, not through a career.
Elite 6.14 & Above
With a Standard Deviation of 6.13, Stroud would be considered the last of the elite QBs by QB Score rankings. Through 16 weeks, eight quarterbacks have achieved elite level(one being Cousins through half a season).
Average to Good 0.00 through 6.13
From Lawrence all the way down to Joe Burrow with a QB Score of 0.13 would be the next tier which would be the serviceable to the very good quarterbacks.
You have the classic group of cagey veteran in here like Stafford, Carr, Flacco, Mayfield and Jordan Love in that area looking like a mini Dak Prescott.
Sixteen quarterbacks fell into this group
Below Average to Bad -6.13 through 0.00
Anthony Richardson would be the beginning of the average to below average tier that ran down through Mitchell Trubisky who is the caboose of the can use them if you have to group.
Eleven quarterback fell into this category.
Bad to Abysmal -6.14 & Below
Mac Jones down to Zappe is the really don’t want to send them out there tier. Daniel Jones is the only patch of green(3.70 Rush score), but he balances it out by having a dead last Pass score of -10.12(Tommy Devito is next to last at -10.06).
Ten quarterbacks wear the QB Score mark of shame this season.
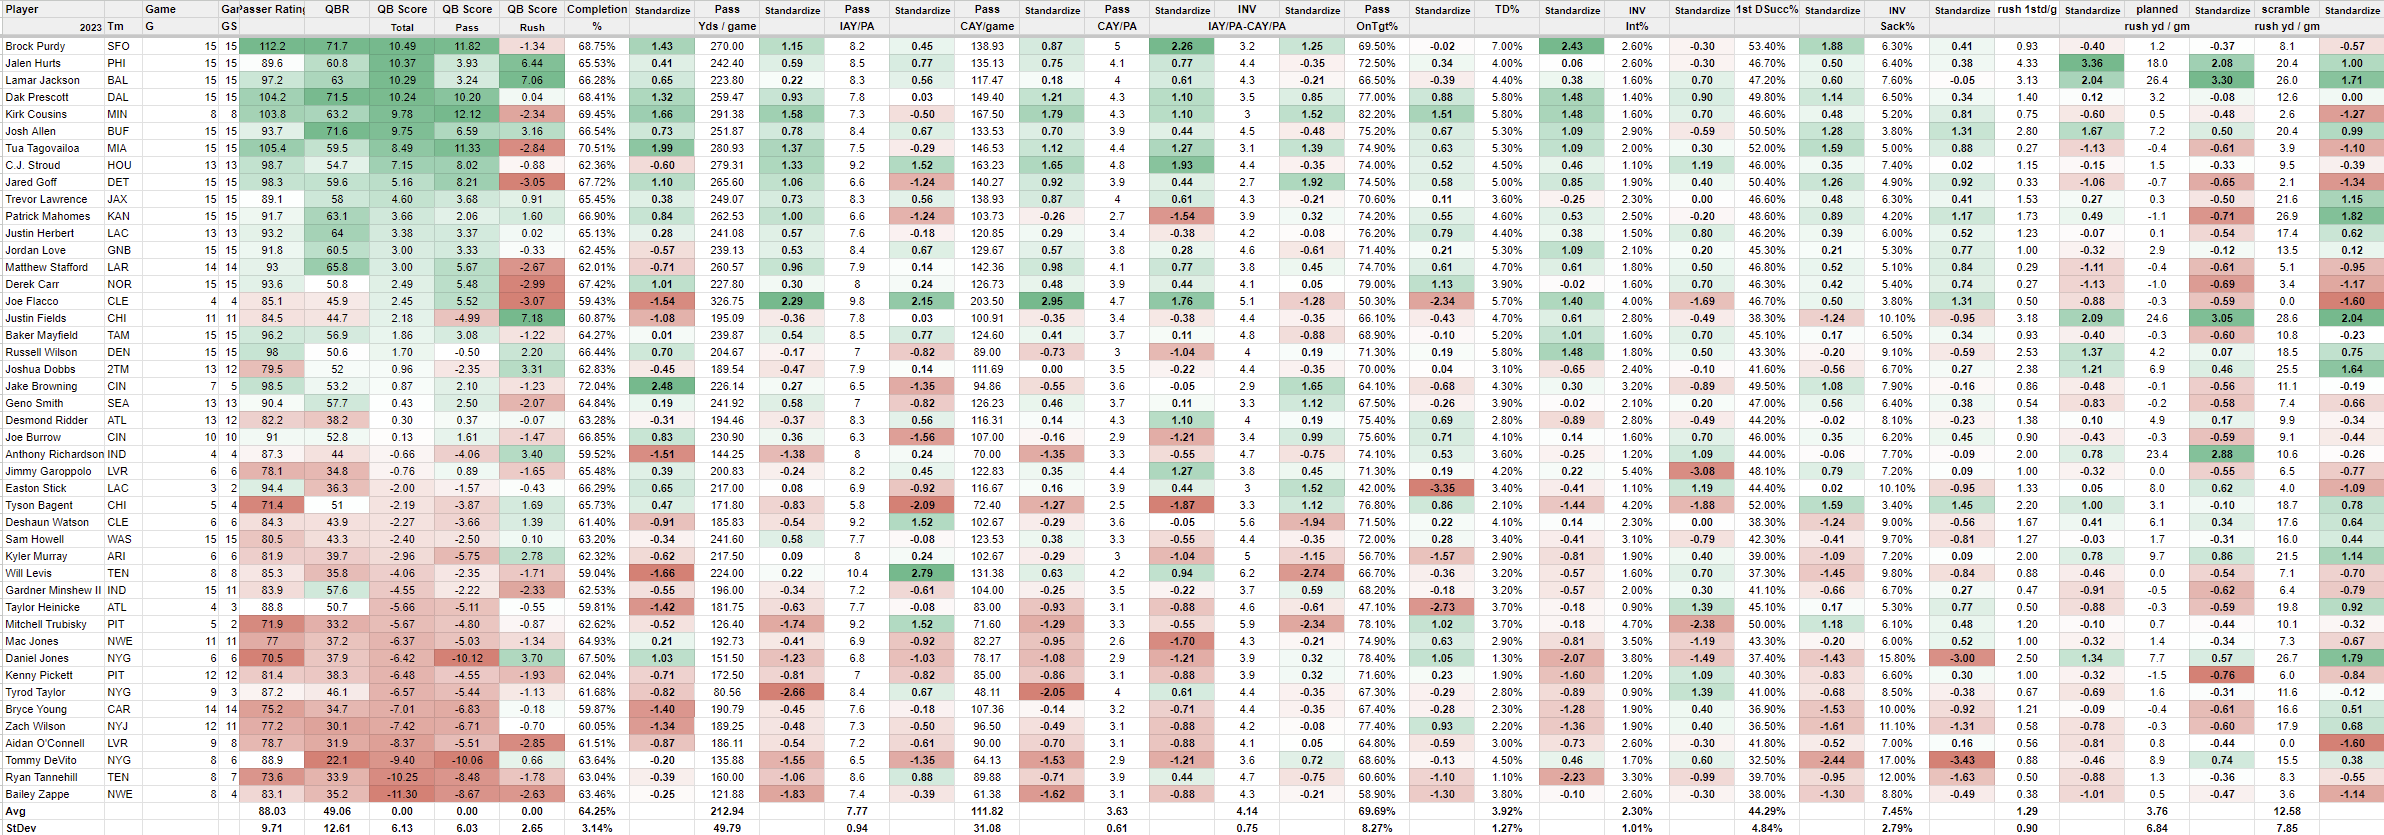
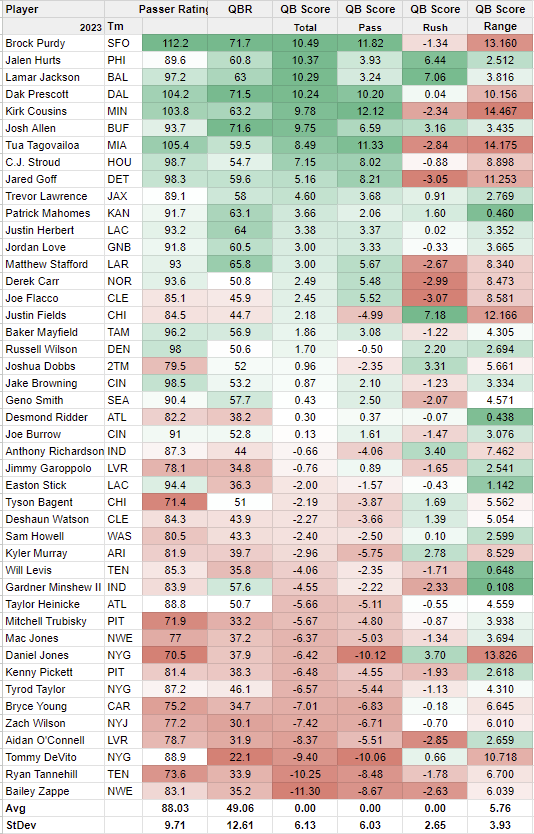
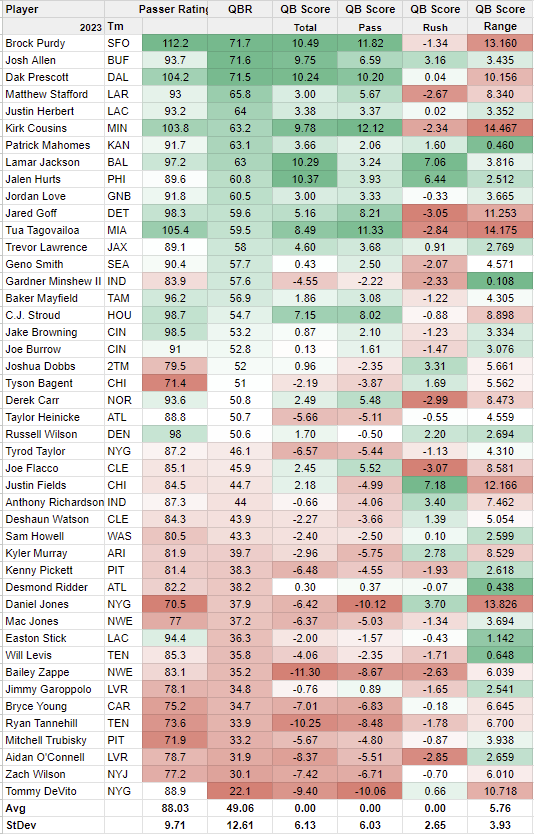
QB Scores Through Week 16
Purdy 10.49
Hurts 10.37
Jackson 10,29
Prescott 10.24
(Cousins 9.78)
Allen 9.75
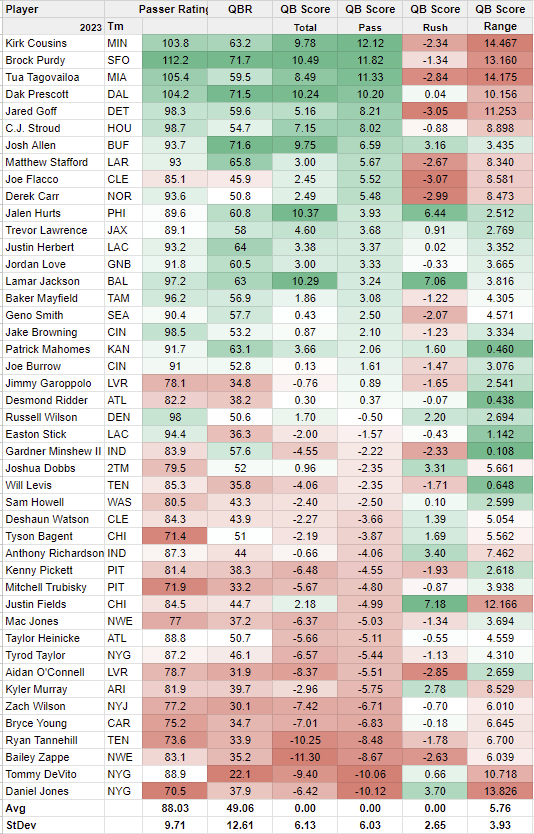
The Best Pure Passers By QB Score Pass Score
You have an unbeatable offensive line and receivers who can get open. You just want the best pure passer even if he is a statue.
Cousins 12.12
Purdy 11.82
Tagovailoa 11.33
Prescott 10.20
Goff 8.21
Stroud 8.01
Allen 6.59
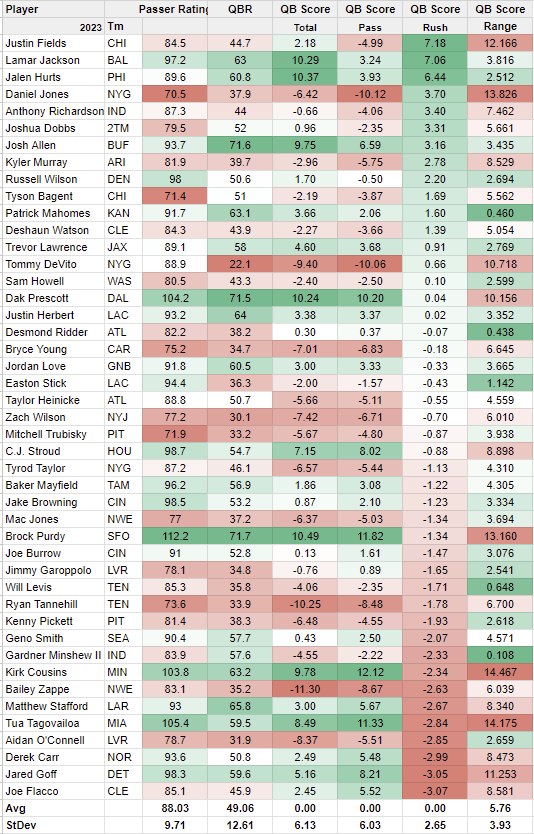
The Best Running Quarterbacks By QB Score Rush Score
You don’t want a pocket passer. You want another running back with the ability to throw the ball at varying levels of proficiency. Your line will help maul your way to victory. You might want to avoid QBs with no passing ability compared to their peers.
Fields 7.18
Jackson 7.06
Hurts 6.44
D. Jones 3.70
Richardson 3.40
Dobbs 3.31
Allen 3.16
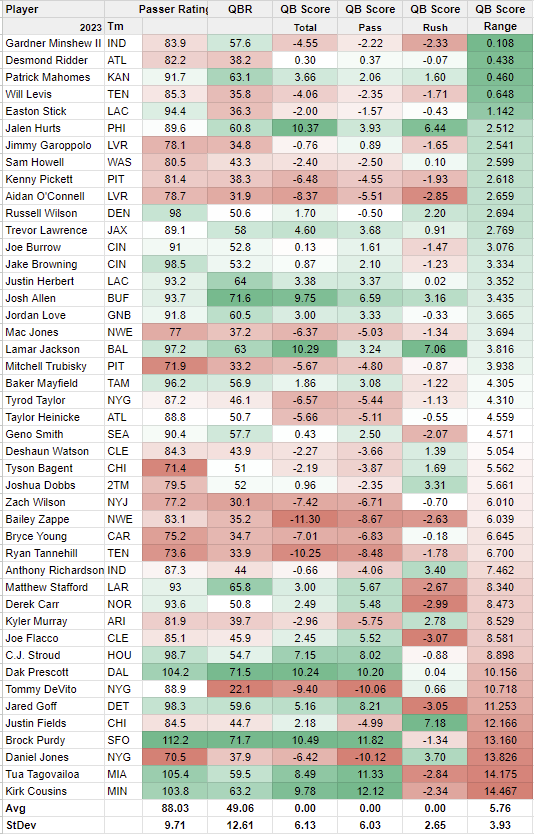
You Want A Quarterback Equally Skilled At Pass & Rush Regardless Of Overall Level
You don’t care how good your quarterback is, you just want him to have the same level of passing skills as he has running skills. This is basically pick out the overall good QBs from this list and eliminate the bad ones no matter where they appear.
Minshew (-4.55) Pass -2.22 Rush-2.33 Range 0.108
Ridder (0.30) Pass 0.37 Rush-0.07 Range 0.438
Mahomes (3.66) Pass 2.06 Rush 1.60 Range 0.460
Levis (-4.06) Pass -2.35 Rush -1.71 Range 0.648
Stick (-2.00) Pass -1.57 Rush -0.43 Range 1.142
Hurts (10.37) Pass 3.93 Rush 6.44 Range 2.512
Both QB Score & Passer Rating Are Hogwash, Gimme Best QBR
Take your QB Score and shove it. While you are at it, put Passer Rating up there with it.
Purdy 71.7
Allen 71.6
Prescott 71.5
Stafford 65.8
Herbert 64
Passing Rating Is Where It’s At
Don’t give me that QB Score or QBR voodoo, I like good old fashioned Passer Rating rankings.
Purdy 112.2
Tagovailoa 105.4
Prescott 104.2
Cousins 103.8
Stroud 98.7
The 5 Quarterbacks who can win MVP
If QB Score were used for MVP consideration, it would be down to just 5 quarterbacks. Four in a virtual dead heat, and a fifth with an outside shot at coming back and stealing the title in the final two games.
Brock Purdy Pocket Passer (10.49)
Purdy’s 11.82 pass score trails only Kirk Cousins’ half season of brilliance. His -1.32 Rush score shows he is a classic Pocket Passer much like Tua Tagovailoa(11.33 pass -2.84 rush)
Purdy’s score is dependent on Completion %, Pass Yards/game, Completed Air Yards/Pass Attempt, TD%, & 1st Down %
He has huge leads in CAY/PA, TD% and 1st Down %, but that puts the onus on him to keep up at those rates or lose points.
Completion % and Pass Yards/ Game are pretty entrenched and would take really bad or amazzing games to move them much. The 4 INT last game brought him back to the field in INT% and really made this a race.
If Purdy could run a bit in the last 2 games, that would be his best chance to make up any points loss in the stats he gets huge points in.
Passer Rating Factor – No one is catching Purdy at 112.2.
QBR Factor – 1st with the slimmest of leads over Allen & Prescott
Jalen Hurts Hybrid-Rusher (10.37)
Hurts(3.93 Pass 6.44 Rush) is vulnerable in 1st Downs per game and planned rush yards per game.
He scores ridiculously high in 1st Downs per game, and quite high in planned rushing yards. So like Purdy he will need to keep up the pass in those categories or risk losing points to the field.
Because he is kind of middle of the pack in many passing stats, two good games against weak opponents could see Hurts rack up the passing stats he needs to take the QB score title.
Passer Rating Factor – Hurts is decidely average at Passer Rating, below Geno Smith.
QBR Factor – Hurts is decent at 9th in QBR
Lamar Jackson Hybrid-Rusher (10.29)
Jackson(3.24 Pass 7.06 Rush) is almost identical to Hurts except he gets massive points in planned rushing yards per game, and high points in 1st downs per game and scramble yards per game.
Just like Hurts he is middle of the pack in many passing stats so a couple of good passing games could see him make up a lot of points in the pass metrics.
Of all the players in the hunt, Jackson is most vulnerable to himself. He must keep up the other worldly rushing metrics or lose points simply for not be superhuman at times.
Passer Rating Factor – Jackson has the 9th spot in Passer Rating
QBR Factor – Jackson sits in 8th in QBR
Dak Prescott Hybrid-Passer (10.24)
Prescott(10.20 Pass 0.04 Rush) is just below Purdy as a pure passer, but has a bit more rushing ability to make up for it. He sits on the borderline between Pocket Passer and Hybrid-Passer and I just chose the latter. You could easily call him a Pocket Passer.
Prescott is decidely average at all the rushing metrics and therefore the overall rush score as well. That is a bit rare as pocket passers tend to have negative rush scores
To stay in the race Prescott will simply need to have his average passing game a few more times. Make good decisions, keep completion % & TD% high, and chip in with a run here and there.
If Prescott were to have 2 good rushing games, he could make up the points he needs without having to do anything more in the passing game than status quo.
Passer Rating Factor – Prescott is 3rd in Passer Rating
QBR Factor – Prescott is 3rd in QBR
Josh Allen Hybrid (9.75)
Note that I did not designate Allen(6.59 Pass 3.16 Rush) as a Hybrid-Rusher or Hybrid-Passer, he is more unicorn than either of those. Mahomes would be in this category during a typical Mahomes season but unfortunately this is a down season for him(2.06 pass 1.60 rush)
No other QB ranks as high in both Passing stats and Rushing stats as Allen. While Hurts & Lamar are very similar and also rare, they do have each other to point to as a similar quarterback. There is no other QB to point to when it comes to Allen’s mix of high level passing and high level rushing.
So how does he make up 0.75 SD units in 2 games? Stop throwing INTs and gunslinging. His INT % and IAT/PA – CAY/PA scores are hurting him aginst the other 4 quaterbacks. A couple successful planned QB draws or sprint out options would help his rushing scores. Just a couple big games are all that are needed, something he is capable of.
The downside is he doesn’t control what the other 4 QBs do. If any of the 4 put together 2 really good games, they may be impossible to catch.
Passer Rating Factor – Allen is 12th in Passer Rating
QBR Factor – Allen is 2nd in QBR
Good Season But Eliminated
Tua Tagovoiloa Pocket Passer (8.49)
Tagovoila(11.33 Pass -2.84 Rush) is very similar to Purdy but just is too far out of it to have a legitimate chance at winning the QB Score title.
His best hope would be a rushing outburst the likes of which could get him hurt so probably not in the cards.
C.J. Stroud Pocket Passer (7.15)
Easily the best rookie QB and a very solid 8th overall(7th if you discount Cousins). The distance from Stroud(8.02 Pass -0.88 Rush) to Goff in 9th is 1.99 points.
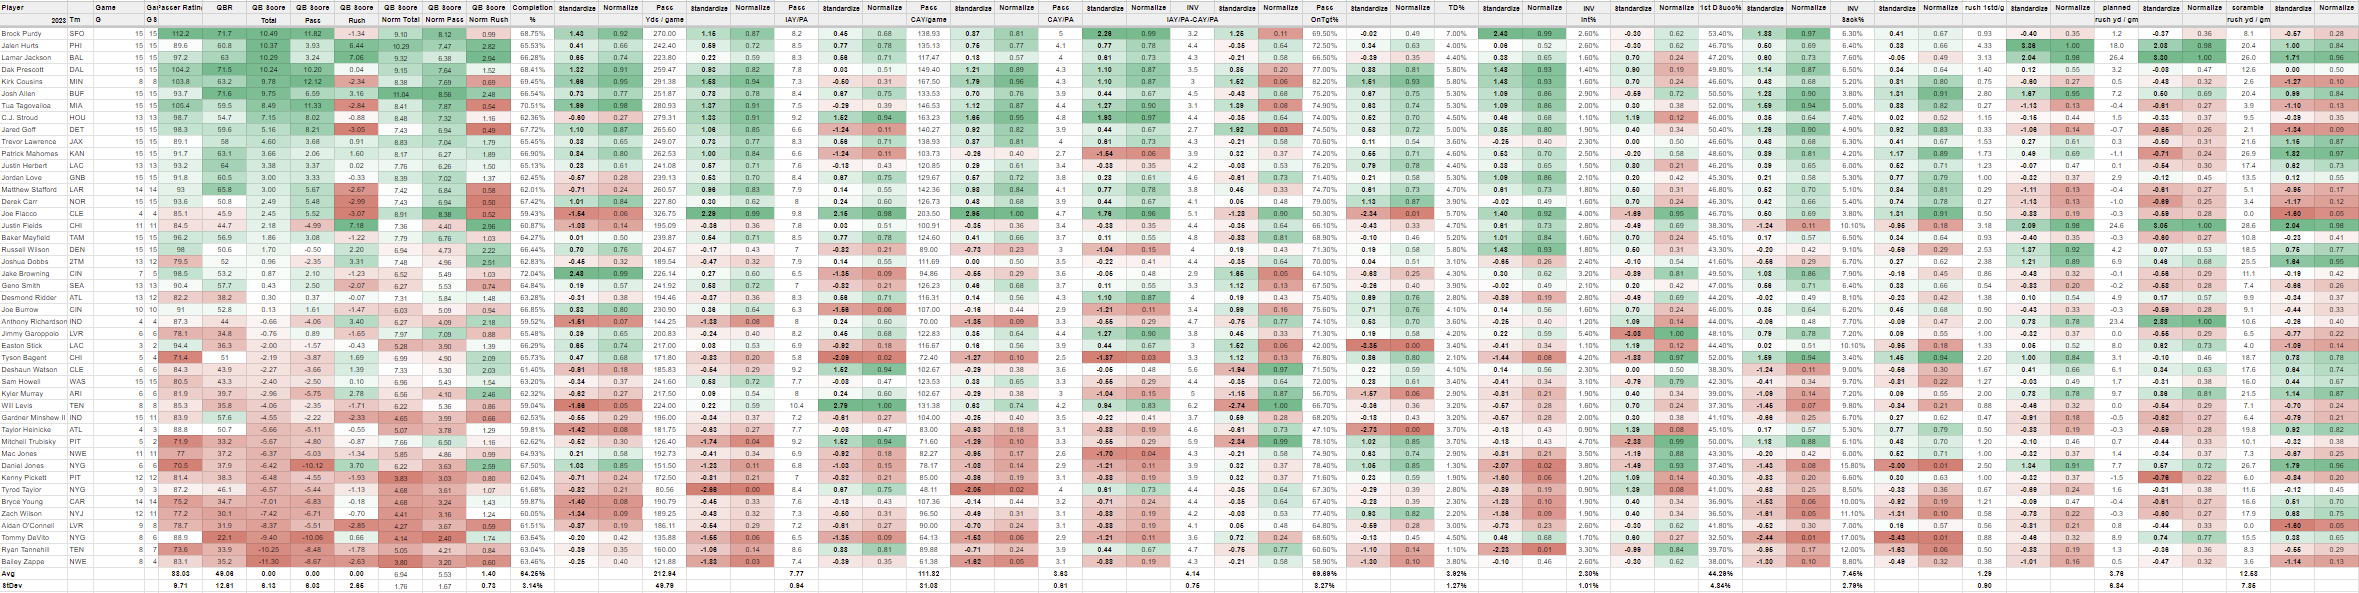
Normalized Rankings
All the above is based on Stadardized scores, or SD units gained or lost.
What if we simply changed all the Standardized scores into Normalized scores?
Normalized would just put them on a scale from .01 to 1.00(Percentile or Z-score) instead of -4.00 SD to +4.00 SD. We can add up the normalized scores for each metric and come up with a QB Score (normalized) ranking.
Before I show those scores, let me tell you why Standardized scoring seems to be a better fit for QB Score than Normalized scoring.
Standardized vs Normalized
Stardardized scoring simply has a larger range. So it allows QBs to score extra points at what they excel at compared to their peers. Normalized scoring will always minimize these difference due to the compressed range of .01 -1.00
It allows us to see larger gaps between QBs in different scores more easily.
It also really does a good job of classifying the quarterbacks and making it easy to tell one type from another.
It has an average score of 0.00 making it easy to put QBs into tiers by using the STDEV of the QB Score itself and very simple for the average fan to interpret.
Normalized QB Scores
Allen 11.04
Hurts 10.29
Jackson 9.32
Prescott 9.15
Purdy 9.10
Flacco 8.91
Lawrence 8.83
Stroud 8.48
Tagovoiloa 8.41
Love 8.39
Cousins 8.38
Mahones 8.17
You can see by a few of the names in that list that quarterbacks are not being punished or rewarded as much in each category, but the cream still rises to the top.
Normalization would likely lead to the pure Hybird type to score highest as they would consistently score high in almost every stat. Any real warts would be plastered over by the smaller normalization range so in the end they would score out quite high.
Overall though it just doesn’t pass the smell test. To use normalized scoring the stat categories would need to be weighted, and if we are going to do that, why not just go with Standard Deviation Units as the scoring value?
QB Score will be updated after weeks 17 & 18 for all those who are interested in the battle for the first QB Score title. It is likely that MVP will come from one of the five quarterbacks profiled in this article. Which will it be? They all have 2 games left to earn the crown.