
NFL 2023 Offensive Line Ratings & Rankings
The methodology of the offensive line rankings was explained in this post:
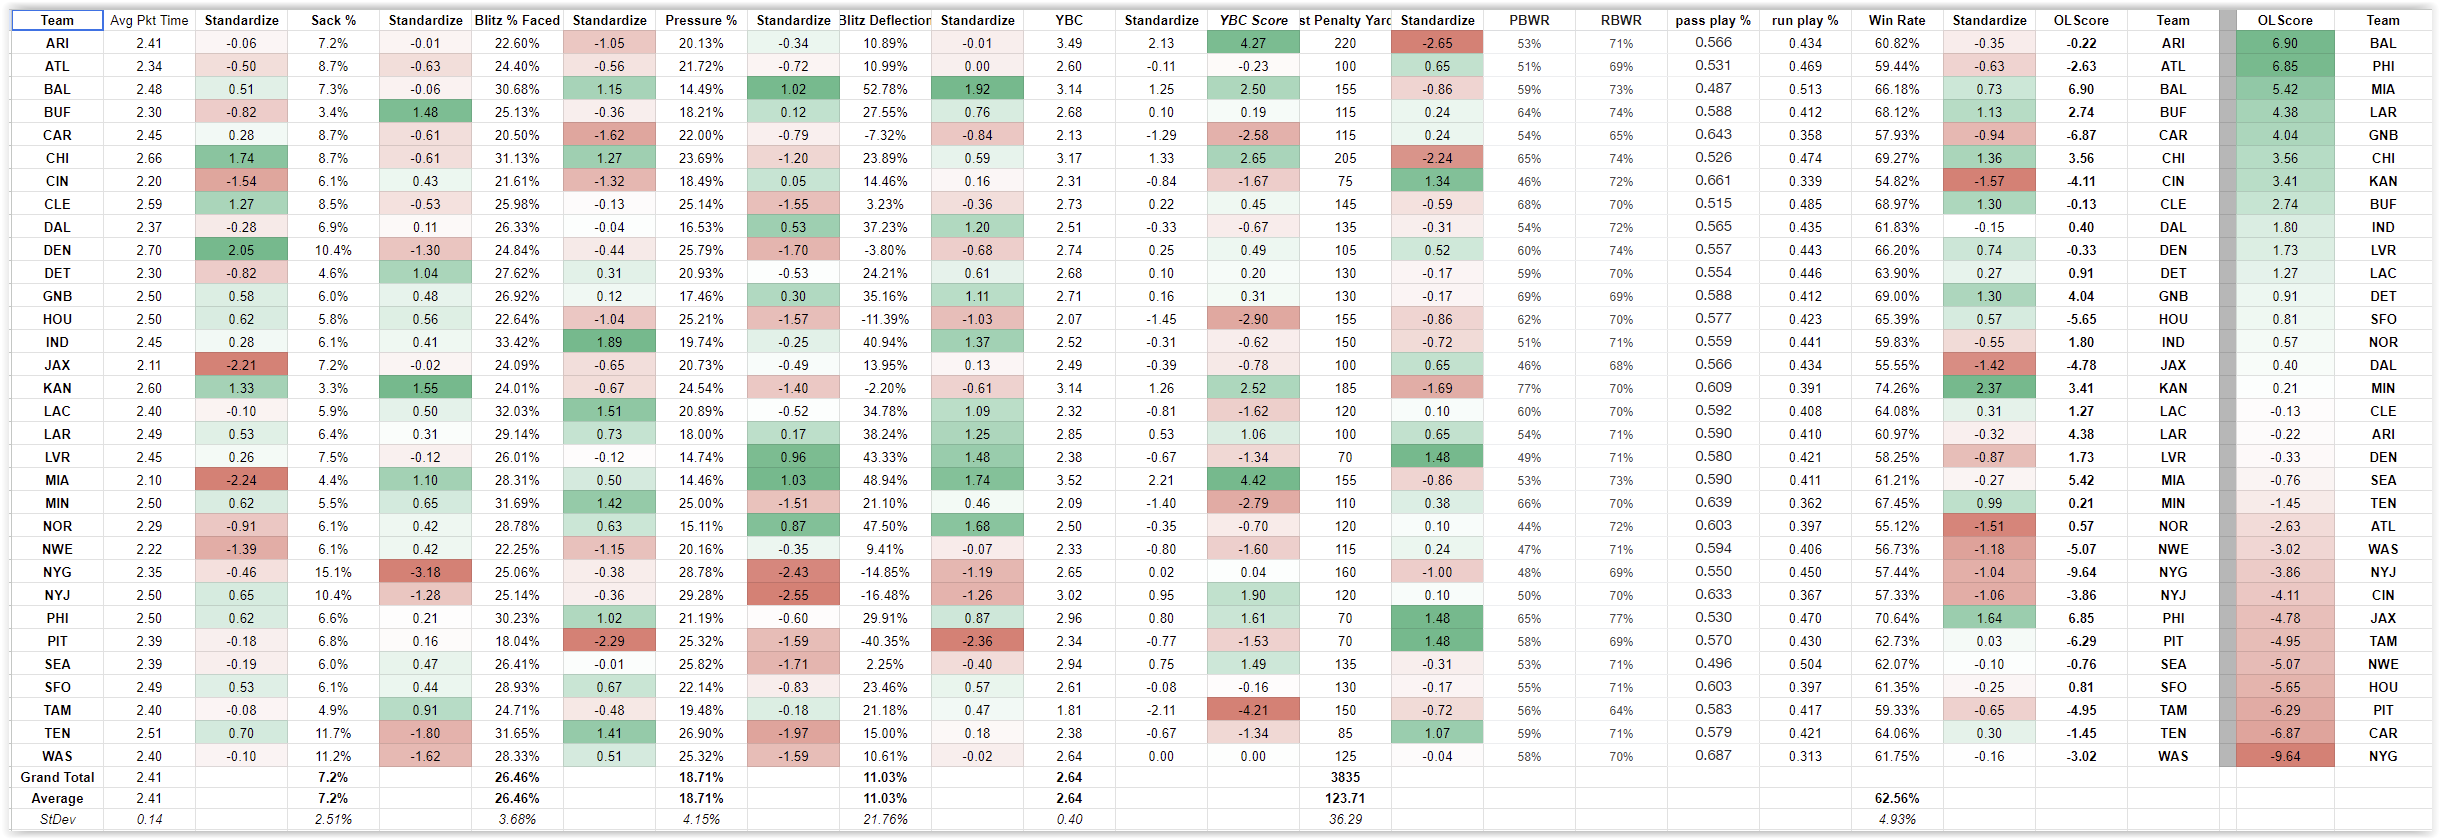
NFL 2023 – Comparative Offensive Line Ratings & Rankings.
New 2024 Rankings – 2024 Team Offensive Rankings Through Week 3
Now lets walk through the rankings and identify the strengths and weaknesses of each line based on the metrics used in the offensive line rankings. At the end of each team capsule will be a short short note summarizing the data.
Final 2023 Team Offensive Line Summaries can be found here:
NFL 2023 – Comparative Offensive Line Rankings & Ratings – Final Rankings
NFL 2023 Team Offensive Line Ratings & Rankings – Final Rankings
Strengths & Weaknesses Scale
For individual metrics, the following scale was used to categorize performance in the metric. It is simply using the standard deviation ranges to quantify metric into a simple adjectives.
Real Strength = 1.01+
Strength = 0.00 thru 1.00
Weakness = 0.00 thru -1.00
Real Weakness = -1.01 or below
Note – The StDev units for the YBC metric are doubled for scoring, but for strengths & weaknesses the base score(pre-doubled) is used.
Offensive Line Score is COMPARATIVE. This means all strengths & weaknesses are in comparison to all other offensive lines in that statistic/metric. Thus the scoring is essentially a Net Zero system. For one line to get +1.5 StDev score in a metric, another line must score roughly -1.5 StDev to balance the range.
Blitz% listed as a strength means the line has face a high % of blitzes to produce the stats they have. Conversely, Blitz % listed as a weakness means the line has not faced the blitz as much as other teams. Blitz% is not measuring the line effectiveness against the blitz but rather accounting for how often they have faced it. The Blitz Deflection metric is what is measuring their ability to handle the blitz regardless of the amount they have faced it.
#1 – Baltimore Ravens 6.90
Real Strengths: 4
- Blitz %
- Pressure %
- Blitz Deflection
- Yards Before Contact
Strengths: 2
- Average Pocket Time
- Overall Block Win Rate
Weaknesses: 1
- Sack %
Real Weaknesses: 1
- Penalties
Note – The Ravens line needs to clean up the penalties. That’s about the only complaint.
#2 – Philadelphia Eagles 6.85
Real Strengths: 3
- Penalties
- Blitz %
- Overall Block Win Rate
Strengths: 4
- Average Pocket Time
- Sack %
- Blitz Deflection
- Yards Before Contact
Weaknesses: 1
- Pressure %
Real Weaknesses: 0
Note – I’m not sure the Eagles offensive line is as dominent all around as it was last year. It is still quite good, but it feels like Hurts is being flushed and pressured a bit more this year.

#3 – Miami Dolphins 5.42
Real Strengths: 4
- Yards Before Contact
- Pressure %
- Blitz Deflection
- Sack %
Strengths: 1
- Blitz %
Weaknesses: 2
- Penalties
- Overall Block Win Rate
Real Weaknesses: 1
- Average Pocket Time
Note – The Dolphins scheme is to get the ball out quickly so the poor average pocket time may be a result of sending out extra receivers. This line is opening huge holes for the running game despite the penalties and the overall block win rate not being great.
#4 – Los Angeles Rams 4.38
Real Strengths: 1
- Blitz Deflection
Strengths: 6
- Blitz %
- Yards Before Contact
- Pressure %
- Sack %
- Penalties
- Average Pocket Time
Weaknesses: 1
- Overall Block Win Rate
Real Weaknesses: 0
Note – The Rams have just a good solid offensive line. A little more investment here could make this a formidable unit next year.
#5 – Green Bay Packers 4.04
Real Strengths: 2
- Blitz Deflection
- Overall Block Win Rate
Strengths: 5
- Yards Before Contact
- Pressure %
- Average Pocket Time
- Blitz %
- Sack %
Weaknesses: 1
- Penalties
Real Weaknesses: 0
Note – The quality of the Packers line play does not speak well to Jordan Love’s unimpressive numbers so far. They take a few too many penalties, but overall they have been pretty good.
#6 – Chicago Bears 3.56
Real Strengths: 4
- Average Pocket Time
- Blitz %
- Yards Before Contact
- Overall Block Win Rate
Strengths: 1
- Blitz Deflection
Weaknesses: 1
- Sack %
Real Weaknesses: 2
- Penalties
- Pressure %
Note – The Bears offensive line would seem to be a good unit being hampered by quarterback indecision. They allow 2.66 sec of pocket time and win blocks, but are giving up sacks and pressure because the qb is holding the ball too long.
#7 – Kansas City Chiefs 3.41
Real Strengths: 4
- Average Pocket Time
- Sack %
- Yards Before Contact
- Overall Block Win Rate
Strengths: 0
Weaknesses: 2
- Blitz %
- Blitz Deflection
Real Weaknesses: 2
- Penalties
- Pressure %
Note – The Chiefs big bugaboo has been penalties. The are not facing many blitzes but seem to have trouble handling it. They may want to look to ground and pound a bit more as the line seems well suited to that.
#8 – Buffalo Bills 2.74
Real Strengths: 2
- Sack %
- Overall Block Win Rate
Strengths: 4
- Yards Before Contact
- Pressure %
- Penalties
- Blitz Deflection
Weaknesses: 2
- Average Pocket Time
- Blitz %
Real Weaknesses: 0
Note – The Bills have a good line that seems to have underperformed a bit. They are not facing a lot of blitzing, but they are not allowing a lot of pocket time either(2.30s). The Bills are another team that has a line that would appear to want to run the ball more than they do.

#9 – Indianapolis Colts 1.80
Real Strengths: 3
- Blitz %
- Blitz Deflection
- Overall Block Win Rate
Strengths: 2
- Average Pocket Time
- Sack %
Weaknesses: 3
- Yards Before Contact
- Pressure %
- Penalties
Real Weaknesses: 0
Note – The Colts have a decent offensive line that has some obvious warts. They aren’t good at running the ball, they take too many penalties, and give up too much pressure. They do pick up the blitz well and give Minshew enough time to throw in a clean pocket.
#10 – Las Vegas Raiders 1.73
Real Strengths: 2
- Blitz Deflection
- Penalties
Strengths: 2
- Average Pocket Time
- Pressure %
Weaknesses: 4
- Sack %
- Blitz %
- Yards Before Contact
- Overall Block Win Rate
Real Weaknesses: 0
Note – The Raiders line has some blocking issues. They are disciplined and pick up what little blitzes they see fairly well. They do not open a lot of running lanes and in general aren’t that great at winning blocks consistently as a unit.
#11 – Los Angeles Chargers 1.27
Real Strengths: 2
- Blitz %
- Blitz Deflection
Strengths: 3
- Sack %
- Penalties
- Overall Block Win Rate
Weaknesses: 3
- Average Pocket Time
- Pressure %
- Yards Before Contact
Real Weaknesses: 0
Note – The Chargers have a line built to pass protect. That they don’t do it a bit better is a little disappointing but they are at least above average at it. They do however have issues with generating a run game which can make them one dimensional.
#12 – Detroit Lions 0.91
Real Strengths: 1
- Sack %
Strengths: 4
- Yards Before Contact
- Blitz %
- Blitz Deflection
- Overall Block Win Rate
Weaknesses: 3
- Average Pocket Time
- Pressure %
- Penalties
Real Weaknesses: 0
Note – The Lions have a good offensive line that need to clean things up a bit. Stop taking penalties, and give Goff a bit more time to get the ball downfield(which if you look at his metrics, he doesn’t). And let’s start mauling a bit more as the line has the ability to control a game on the ground.
#13 – San Francisco 49ers 0.81
Real Strengths: 0
Strengths: 4
- Sack %
- Average Pocket Time
- Blitz %
- Blitz Deflection
Weaknesses: 4
- Pressure %
- Yards Before Contact
- Penalties
- Overall Block Win Rate
Real Weaknesses: 0
Note – This line isn’t great at opening holes which should speak to the quality of McCaffery. They’re primary task is to give Purdy a clean pocket and let him do his thing. For the most part they have done that, but when they don’t is when we see Purdy get loose with the decision making and throws.
#14 – New Orleans Saints 0.57
Real Strengths: 1
- Blitz Deflection
Strengths: 4
- Sack %
- Pressure %
- Blitz %
- Penalties
Weaknesses: 2
- Average Pocket Time
- Yards Before Contact
Real Weaknesses: 1
- Overall Block Win Rate
Note – Not sure there is all that much here to get excited or annoyed with. The overall block win rate is not good, but somehow they seem to deal with blitzes and pressure ok. Not opening a lot of running lanes, but just your kind of average offensive line in most ways.
#15 – Dallas Cowboys 0.40
Real Strengths: 1
- Blitz Deflection
Strengths: 2
- Sack %
- Pressure %
Weaknesses: 5
- Average Pocket Time
- Blitz %
- Penalties
- Yards Before Contact
- Overall Block Win Rate
Real Weaknesses: 0
Note – There seem to be a lot of minor weaknesses in the Cowboys offensive line for a winning team. The fact that none are real major weaknesses is probably the key. They don’t get blitzed much but seem to deal with it fairly well when they do.

#16 – Minnesota Vikings 0.21
Real Strengths: 1
- Blitz %
Strengths: 5
- Average Pocket Time
- Sack %
- Blitz Deflection
- Penalties
- Overall Block Win Rate
Weaknesses: 0
Real Weaknesses: 2
- Pressure %
- Yards Before Contact
Note – This should be quite interesting as the Vikings are a good pass blocking line set up for a statuesque Cousins. Now they are incorporating Dobbs, and if you look at the Cardinals line stats you will see that they had the highest YBC score, primarily because of Dobbs. The YBC score for the Vikings is a real weakness. If Dobbs flips this and also gets the great pass protection, the Vikings could be a dangerous team.
#17 – Cleveland Browns -0.13
Real Strengths: 2
- Average Pocket Time
- Overall Block Win Rate
Strengths: 1
- Yards Before Contact
Weaknesses: 4
- Sack %
- Blitz %
- Blitz Deflection
- Penalties
Real Weaknesses: 1
- Pressure %
Note – Average pocket time is high yet so is pressure%. Qb holding the ball is the likely culprit.
#18 – Arizona Cardinals -0.22
Real Strengths: 1
- Yards Before Contact
Strengths: 0
Weaknesses: 5
- Sack %
- Average Pocket Time
- Overall Block Win Rate
- Pressure %
- Blitz Deflection
Real Weaknesses: 2
- Blitz %
- Penalties
Note – Arizona’s line ranking is almost entirely dependent on their YBC metric. This was probably enhanced by Josh Dobbs scrambling and running ability. In theory, Kyler Murray should be able to pick up where Dobbs left off as they have similar rushing skills.
#19 – Denver Broncos -0.33
Real Strengths: 1
- Average Pocket Time
Strengths: 3
- Yards Before Contact
- Penalties
- Overall Block Win Rate
Weaknesses: 2
- Blitz %
- Blitz Deflection
Real Weaknesses: 2
- Sack %
- Pressure %
Note – What a strange combination of real strengths & weaknesses. Denver’s line is giving the most average pocket time in the league(2.70s), yet is giving up a lot of pressure & sacks. This speaks directly to a quarterback holding on to the ball too long.
#20 – Seattle Seahawks -0.76
Real Strengths: 0
Strengths: 2
- Sack %
- Yards Before Contact
Weaknesses: 5
- Average Pocket Time
- Penalties
- Overall Block Win Rate
- Blitz %
- Blitz Deflection
Real Weaknesses: 1
- Pressure %
Note – The Seahawks just have a below average line. Smith is probably holding the ball a bit too long this year which is making them look worse than they are. Yet another team that doesn’t run the ball as much as their line is built to do it.
#21 – Tennessee Titans -1.45
Real Strengths: 2
- Blitz %
- Penalties
Strengths: 3
- Average Pocket Time
- Blitz Deflection
- Overall Block Win Rate
Weaknesses: 1
- Yards Before Contact
Real Weaknesses: 2
- Sack %
- Pressure %
Note – It appears teams like to blitz the Titans(Blitz % high means faced a lot of blitzes) and it works based on Sack% & Pressure%. The line is also not taking penalties(holding calls) to stop blitzers.
#22 – Atlanta Falcons -2.63
Real Strengths: 0
Strengths: 2
- Penalties
- Blitz Deflection(0.00)
Weaknesses: 6
- Blitz %
- Average Pocket Time
- Yards Before Contact
- Overall Block Win Rate
- Sack %
- Pressure %
Real Weaknesses: 0
Note – This may be the most polarizing rating in the bunch. I saw other offensive line ranking rating the Falcons quite high, but when using comparative metrics, they are below average in almost every single metric save penalties and Blitz deflection for which the are dead average(0.00 stdev). Perhaps in a vacuum their line looks better, but when compared to the other 31 lines, they are a bit underwhelming.

#23 – Washington Commanders -3.02
Real Strengths: 0
Strengths: 2
- Blitz %
- Yards Before Contact(0.00)
Weaknesses: 4
- Average Pocket Time
- Penalties
- Blitz Deflection(0.00)
- Overall Block Win Rate
Real Weaknesses: 2
- Sack %
- Pressure %
Note – Howell has improved on his sack rate, but you can see the early troubles in the metrics(Sack% and Pressure %). These metrics came while the line was facing a high % of blitzes (28.33%).
#24 – New York Jets -3.86
Real Strengths: 0
Strengths: 3
- Average Pocket Time
- Penalties
- Yards Before Contact
Weaknesses: 1
- Blitz %
Real Weaknesses: 4
- Sack %
- Pressure %
- Blitz Deflection
- Overall Block Win Rate
Note – The Jets are facing a lower than average % of blizes, but are still not picking them up. The overall poor blocking win rate can’t be helping.
#25 – Cincinnati Bengals -4.11
Real Strengths: 1
- Penalties
Strengths: 3
- Blitz Deflection
- Sack %
- Pressure %
Weaknesses: 1
- Yards Before Contact
Real Weaknesses: 3
- Average Pocket Time
- Blitz %
- Overall Block Win Rate
Note – The Bengals line are not facing blitzes, but allow a low average pocket time(2.2sec) and are whiffing on blocks(54.82% win rate). The sack%, pressure% and blitz deflection scores are ok because they don’t face many blitzes, not because they are particularly effective dealing with it.
#26 – Jacksonville Jaguars -4.78
Real Strengths: 0
Strengths: 2
- Blitz Deflection
- Penalties
Weaknesses: 4
- Sack %
- Pressure %
- Yards Before Contact
- Blitz %
Real Weaknesses: 2
- Average Pocket Time
- Overall Block Win Rate
Note – The Jaguars do not have a good line and Lawrence’s knee is not allowing them to roll him out. This line allows a league worse(2.11 sec) avg pocket time and has only a 55.55% overall block win rate.
#27 – Tampa Bay Buccaneers -4.95
Real Strengths: 0
Strengths: 2
- Sack %
- Blitz Deflection
Weaknesses: 5
- Average Pocket Time
- Blitz %
- Pressure %
- Penalties
- Overall Block Win Rate
Real Weaknesses: 1
- Yards Before Contact
Note – The Bucs line is horrendous at Yards Before Contact, a pitiful 1.81 yards, speaking to their inability to generate a run game. The are ok at pass blocking, but when the other team knows you can’t run, the pass blocking gets harder.
#28 – New England Patriots -5.07
Real Strengths: 0
Strengths: 2
- Sack %
- Penalties
Weaknesses: 3
- Blitz Deflection
- Pressure %
- Yards Before Contact
Real Weaknesses: 3
- Average Pocket Time
- Blitz %
- Overall Block Win Rate
Note – The Pats do not face blitzes, yet they allow only 2.22 sec of pocket time and win 56.73% of their blocks, with a diabolical 44% pass block win rate. Combine that with an inability to open running lanes(YBC 2.33) and you have a fairly ineffective offensive line.

#29 – Houston Texans -5.65
Real Strengths: 0
Strengths: 3
- Average Pocket Time
- Sack %
- Overall Block Win Rate
Weaknesses: 1
- Penalties
Real Weaknesses: 4
- Blitz %
- Blitz Deflection
- Pressure %
- Yards Before Contact
Note – The Texans do not face many blitzes which is good because they don’t pick them up very well. They are also not opening any running lanes as evidenced by the dreadful 2.07 yards before contact stat.
#30 – Pittsburgh Steelers -6.29
Real Strengths: 1
- Penalties
Strengths: 2
- Sack %
- Overall Block Win Rate
Weaknesses: 2
- Average Pocket Time
- Yards Before Contact
Real Weaknesses: 3
- Blitz %
- Blitz Deflection
- Pressure %
Note – The Steelers line would seem ok if you just looked at overall block win rate and penalties. But they don’t allow their qb a lot of time, they don’t open holes for the running game, and they allow pressure while facing a league low amount of blitzing(only 18.04%). Teams think they can beat the Steelers playing vanilla defense, and Tomlin’s coaching acumen might be the factor allowing the Steelers to win despite being outgained in every game thus far.
#31 – Carolina Panthers -6.87
Real Strengths: 0
Strengths: 2
- Average Pocket Time
- Penalties
Weaknesses: 4
- Sack %
- Overall Block Win Rate
- Blitz Deflection
- Pressure %
Real Weaknesses: 2
- Blitz %
- Yards Before Contact
Note – The Panthers are another team that cannot run the ball. In fact they just seem to be a bad, but disciplined, unit. Clearly the Panthers need to invest in their line before they can hope for great things from Bryce Young.
#32 – New York Giants -9.64
Real Strengths: 0
Strengths: 1
- Yards Before Contact
Weaknesses: 3
- Average Pocket Time
- Blitz %
- Blitz Deflection
Real Weaknesses: 4
- Sack %
- Pressure %
- Penalties
- Overall Block Win Rate
Note – The Giants offensive line just flat out stinks. The one strength(YBC) scored them all of 0.02 points(0.04 when doubled!). They were off the scale horrible in both sack%(-3.18) and pressure%(-2.43), and woeful in just about every other metric. And they give up all this pressure and sacks while taking a ton of penalties. This is incompetence on a grand scale. If we completely removed the -3.18 score for sack% and only scored the Giants in 7 stats, they would still be 31st(-6.46).