
NFL 2023 – Comparative Offensive Line Rankings & Ratings – Final Rankings
Comparing NFL Offensive Lines
New Rankings: 2024 NFL Offensive Line Rankings
Rating NFL Offensive Line units is a bit of a tricky proposition. Most rankings involve looking at the individual linemans’ grades and or block win rates. These individual grades are excellent for determining the play and value of individual lineman, but do not really speak to the effectiveness of the unit as a whole over the course of a season.
Final 2023 Team Offensive Line Summaries can be found here:
NFL 2023 Team Offensive Line Ratings & Rankings – Final Rankings
Midseason Offensive Line Rankings:
NFL 2023 Offensive Line Ratings & Rankings
NFL 2023 – Comparative Offensive Line Ratings & Rankings
Like almost all the ratings on nfllines.com, Offensive Line Ratings are COMPARATIVE. The offensive lines get their scores in each metric based on their performance against all other teams, not against a set standard. While against a set standard, every offensive line could grade out or score an 80, meaning they are all equally good.
In comparative ratings, the chances of that happening are virtually zero. Comparative ratings will almost always sort out a ranking. Unfortunately that means someone has to be first and someone last, even when such a title is not deserved. In rare instances, this can lead to the best of a mediocre bunch being #1 and appearing great, or the worst of a fantastic bunch being last and appearing incompetent.
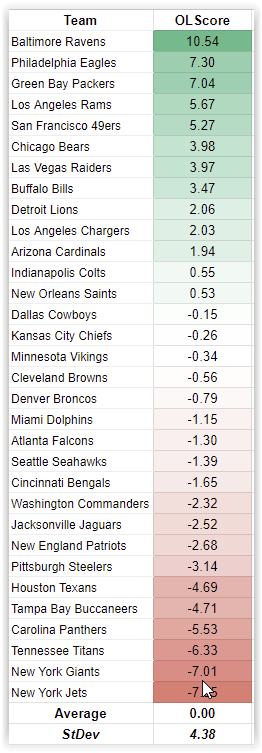
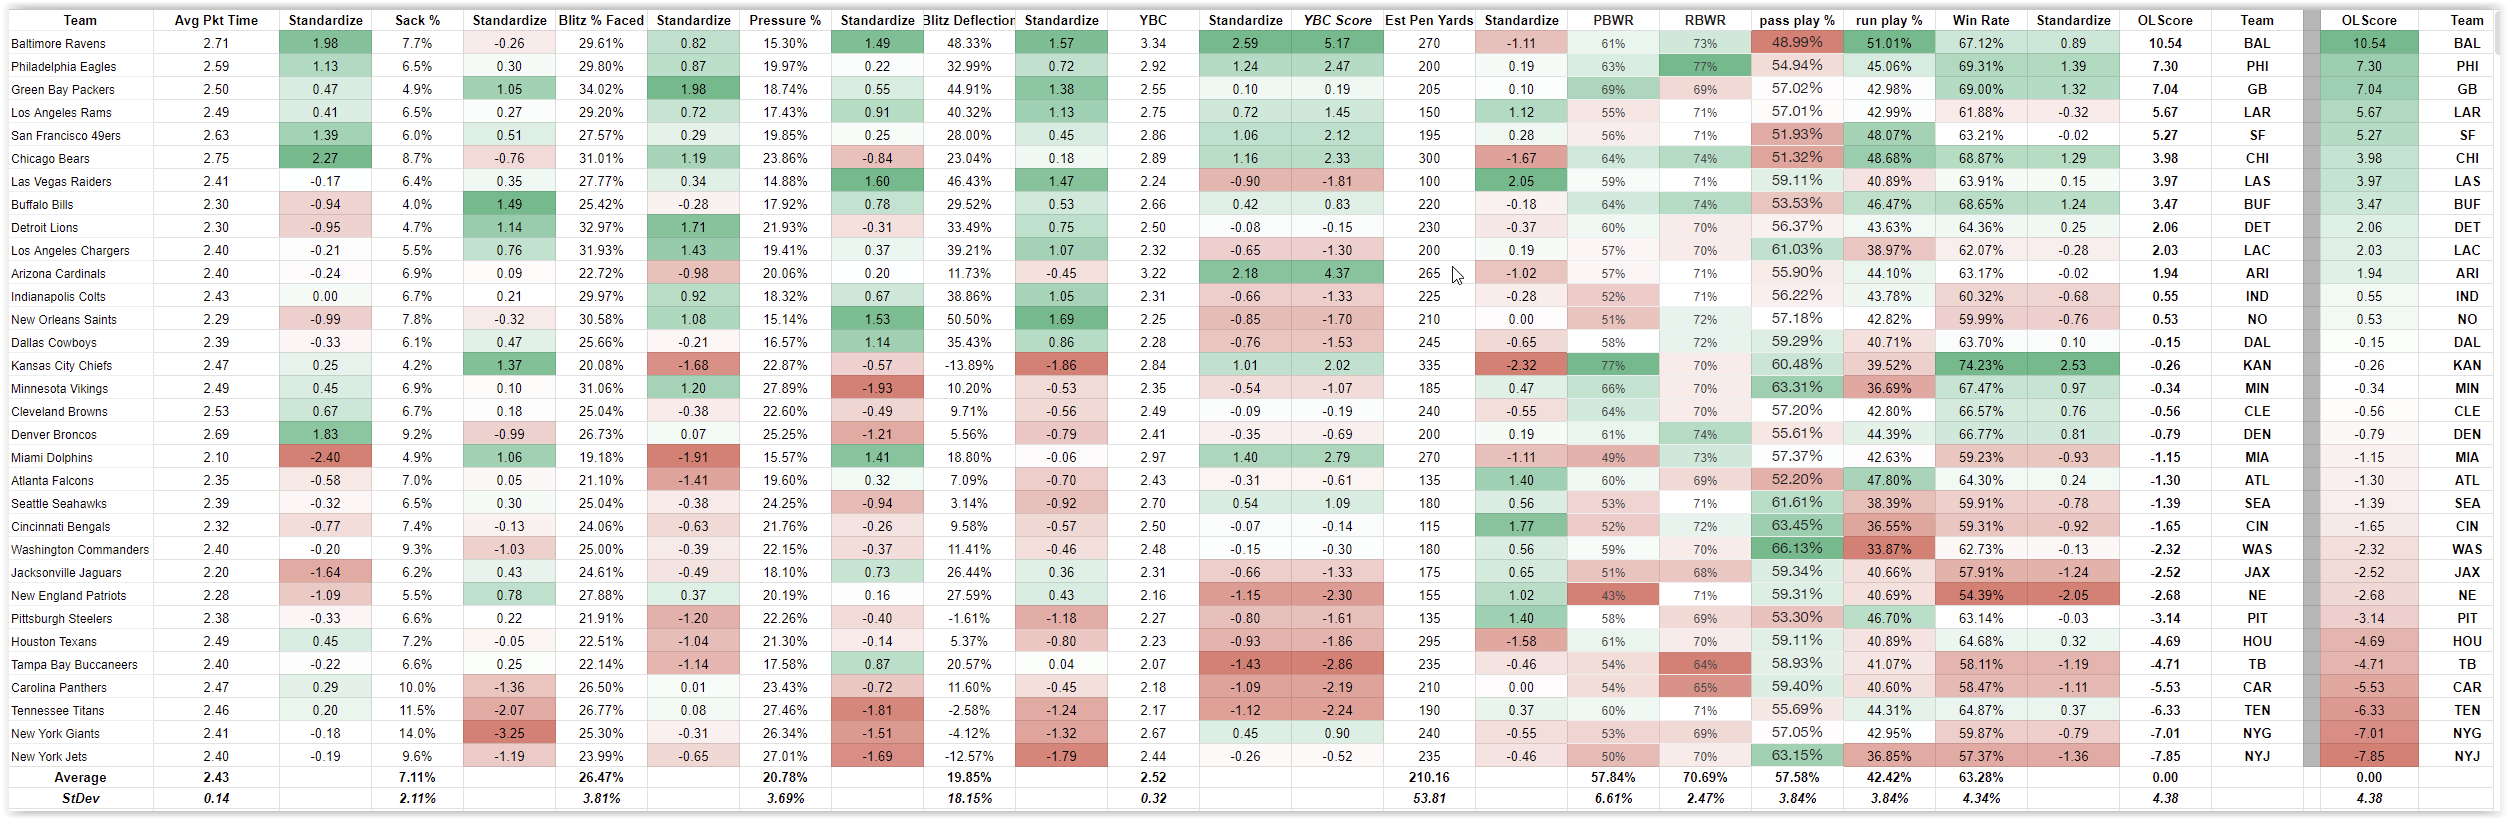
Offensive Line Score Rankings & Ratings
Using StDev allows us to easily segment performance by SD units.
With an Average of 0.00 & StDev of 4.38 we can use the following as a guide:
Exceptional 8.77+
Very Good to Great 4.39 to 7.76
Average to Very Good 0 to 4.38
Poor to Average -4.38 to 0
Very Poor to Poor -8.76 to -4.39
Dismal -8.77 & Below
Scores 2SD & above or -2SD & below will be marked in bold.
Top 5 Offensive Lines
- Baltimore (2.41)
- Philadelphia
- Green Bay
- L.A. Rams
- San Francisco
Bottom 5 Offensive Lines
28. Tampa Bay
29. Carolina
30. Tennessee
31. NY Giants
32. NY Jets
Breaking Down Offensive Line Score Into Pass, Run, Block/Penalty Components
PASS COMPONENTS
- Blitz %
- Pressure %
- Blitz Deflection %
- Average Pocket Time
- Sack %
RUN COMPONENT
- Rushing Yards Before Contact x 2
BLOCK / PENALTY YARDAGE COMPONENT
- Estimated Penalty Yards
- Overall Block Win%
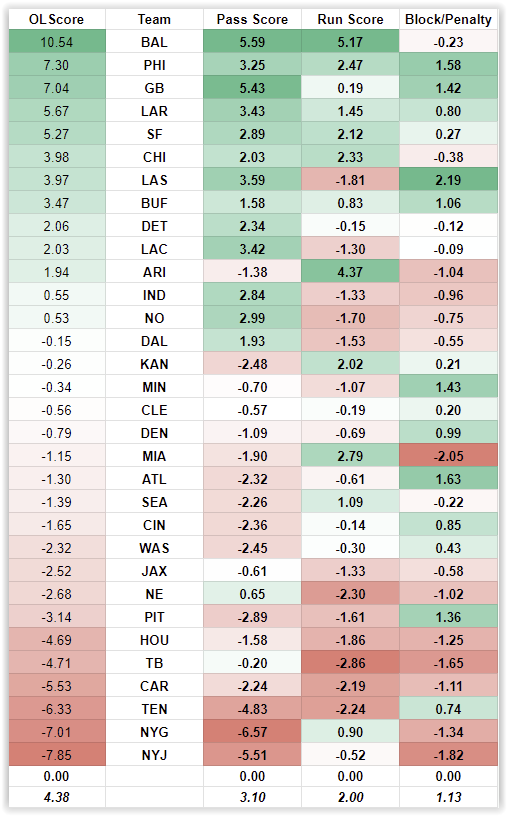
- Baltimore has the highest Offensive Line Pass Score(5.59). Green Bay is 2nd (5.43). NYG are last (-6.57).
- Baltimore has the highest Offensive Line Run Score (5.17).Arizone is 2nd (4.37). TB is last(-2.86).
- The Raiders have the best combined Block Win Rate & Penalties score(2.19). ATL is 2nd(1.63), MIA is last (-2.05).
The Role & Metrics of the Offensive Line
For the offensive line ratings, we are going to assume that the offensive line’s 4 main objectives are:
- Open holes for the rushing game
- Identify, adjust and negate blitzes
- Protect the quarterback for a reasonable amount of time
- Win & hold blocks as a unit
In addition, like any other player or unit on the field, they should accomplish this without drawing fouls. Since this is basically a given for all units/players, I won’t list it as a main objective, but offensive lines will be scored on their ability to avoid costly penalties.
The List of Offensive Line Metrics
- Rushing Yards Before Contact x 2
- Blitz %
- Pressure %
- Blitz Deflection %
- Average Pocket Time
- Sack %
- Estimated Penalty Yards
- Overall Block Win%
Let’s look at each objective and identify the metric(s) used to measure the line’s effectiveness.
Opening Holes For The Rushing Game
Clearly one of the offensive line’s main tasks is to run block effectively. An offensive line that cannot run block and create opportunities for ball carriers is going to find itself forced into a lot of predictable pass block situations. Without the threat of an effective running game, defensive players can sit on pass routes and pass rushers can pin their ears back.
The metric to be used to measure run block effectiveness is Rushing Yards Before Contact(YBC), and this will be the only rushing metric used.. While the ball carrier’s ability is certainly a part of the metric, the size of the hole, or the time until the first defender can make contact with a ball carrier, is primarily a result of blocking. And while wide receivers and tight end blocking is also a factor, we can simply assume that all wr/te blocks are equal(which they surely are not), and assume these blocks are simply an extension of the line blocking(or that the wr/te in the play assume linemen status for the play).
Because the run game can in and of itself win ball games, and an effective run game compliments an effective pass game, the value of this metric will be doubled(the score each line receives for this metric is multiplied by two). Thus the score you see in the Standardized YBC column is the sd value, and the next column shows the YBC score(its SD value * 2).
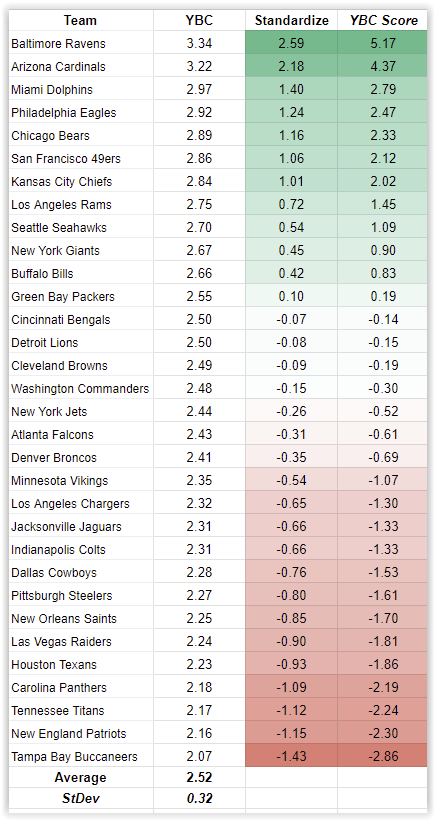
Yards Before Contact Ratings & Rankings
Using StDev allows us to easily segment performance by SD units.
With an Average of 2.52 StDev of 0.32 we can use the following as a guide:
Exceptional 3.17+
Very Good to Great 2.85 to 3.16
Average to Very Good 2.52 to 2.84
Poor to Average 2.30 to 2.52
Very Poor to Poor 2.08 to 2.29
Dismal 2.07 & Below
Top 5 Teams – Yards Before Contact
- Baltimore (2.59)
- Arizona (2.18)
- Miami
- Philadelphia
- Chicago
Bottom 5 Teams -Yards Before Contact
28. Houston
29. Carolina
30. Tennessee
31. New England
32. Tampa Bay
Identifying, Adjust To, And Negate Blitzes
This is probably the most difficult and important task assigned to the offensive line. Before providing time for a quarterback to throw, the line must identify the pass rushers, call the line protection, and still be aware of any misidentifications or additional blitzers not accounted for pre-snap. If any of this goes wrong without a blitz, it can lead to a negative play. When it goes wrong with a blitz, the potential for disasterous outcomes rises significantly.
We are going to assign three metrics to measuring this task:
Blitz % Faced– An offensive line that faces a high amount of blitzing will score more higher in this metric. The purpose of this metric is to measure the amount of blitzes the line has had to face while producing the stats it has. It should be clear that a line facing 30% blitz % who gave up just 5 sacks, is probably more effective than a line who faced a 15% blitz % and gave up 5 sacks. Either the blitz pickup of the latter line is not good OR they are getting beat without a blitz.
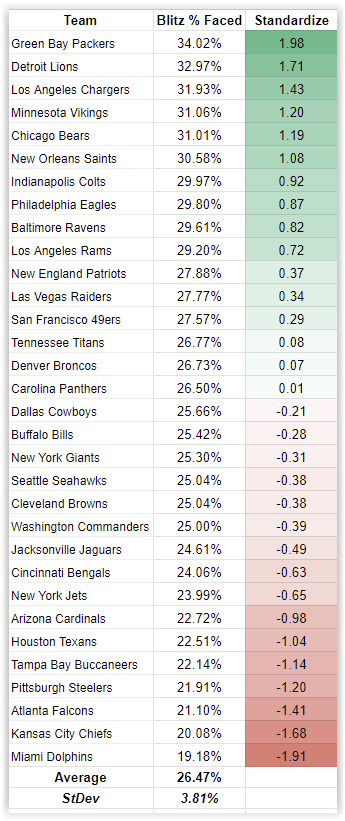
Blitz% Faced Ratings & Rankings
Using StDev allows us to easily segment performance by SD units.
With an Average of 26.47% StDev of 3.81% we can use the following as a guide:
Exceptional 34.08%+
Very Good to Great 30.26% to 34.07%
Average to Very Good 26.47% to 30.25%
Poor to Average 22.66% to 26.47%
Very Poor to Poor 18.85% to 22.65%
Dismal 18.84% & Below
Top 5 Teams – Blitz% Faced
- Green Bay
- Detroit
- L.A. Chargers
- Minnesota
- Chicago
Bottom 5 Teams – Blitz% Faced
28. Tampa Bay
29. Pittsburgh
30. Atlanta
31. Kansas City
32. Miami
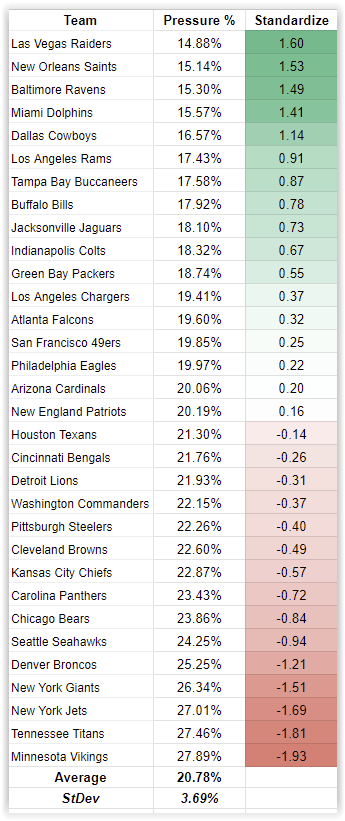
Pressure % Allowed – Pressure % is simply the amount of hurries, knockdowns and sacks as a cumulative total, changed into a percentage by dividing that sum by the amount of pass attempts, scrambles & sacks. It assigns equal weight to a knockdown, a hurry and a sack even though they each have different Expected Point values, and affects on down/distance/outcome.
For measuring purposes, offensive lines that allow the least amount of pressure will score highest.
Pressure% Allowed Ratings & Rankings
Using StDev allows us to easily segment performance by SD units.
With an Average of 20.78% StDev of 3.69% we can use the following as a guide:
Exceptional 13.39% & Below
Great to Very Good 13.40% to 17.08%
Very Good to Average 17.09% to 20.78%
Average to Poor 20.78% to 34.47%
Poor to Very Poor 24.48% to 28.28%
Dismal 28.29%+
Top 5 Teams – Pressure% Allowed
- Las Vegas
- New Orleans
- Baltimore
- Miami
- Dallas
Bottom 5 Teams – Pressure% Allowed
28. Denver
29. NY Giants
30. NY Jets
31. Tennesee
32. Minnestoa
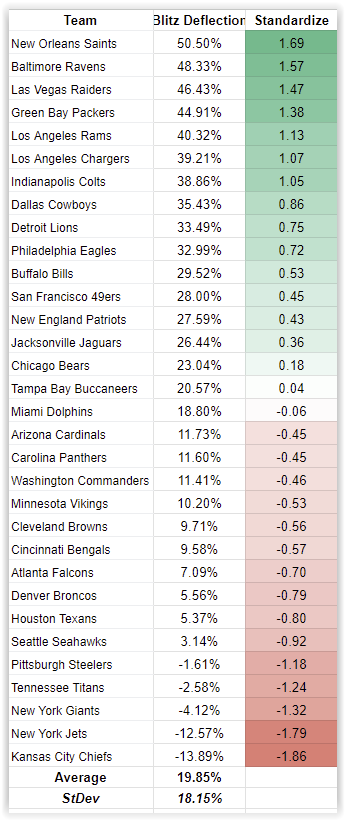
Blitz Deflection % – This is a metric you have never heard of because I just made it up. I am defining Blitz Deflection % as [1 – (Pressure % / Blitz %)]. Let’s look at a simple example of what it is and why it may be a valuable metric.
Let’s assume a line has faced a Blitz % of 25%. Let’s also assume, that every blitz leads directly to pressure. Thus a Blitz % of 25% should lead to a Pressure % of 25%. Essentially, blitzes always work. Thus if a team faces 25% Blitzes, then the average line would allow 25% pressure.
A line that could keep pressure % BELOW Blitz % would be doing a better job than a line who’s Pressure % was higher than their Blitz %. If this happens the line must be giving up pressure outside the Blitz and negating little to none of the blitzes sent.
Just remember Blitz Deflection is not measuring the actual amount of blitz pickups, but the theoretical amount a line is negating blitzes.
Blitz Deflection% Ratings & Rankings
Using StDev allows us to easily segment performance by SD units.
With an Average of 19.85% StDev of 18.15% we can use the following as a guide:
Exceptional 56.17%+
Very Good to Great 38.01% to 56.16%
Average to Very Good 19.85% to 38.00%
Poor to Average 0.70% to 19.84%
Very Poor to Poor -17.55% to 0.69%
Dismal -17.56% & Below
Top 5 Teams – Blitz Deflection %
- New Orleans
- Baltimore
- Las Vegas
- Green Bay
- L.A. Rams
Bottom 5 Teams – Blitz Deflection %
28. Pittsburgh
29. Tennessee
30. NY Giants
31. NY Jets
Protect the Quarterback for a Reasonable Amount of Time
Regardless as to whether the blitz pickup has been identified and executed properly, the offensive line is still tasked with giving the quarterback enough time to go through his reads and complete the passing motion. It would be great if the qb is still standing and in the pocket when this is completed, but sometimes things go wrong and quarterbacks get sacked.
The two metrics being used in this portion of the offensive line ratings are fairly straightforward.
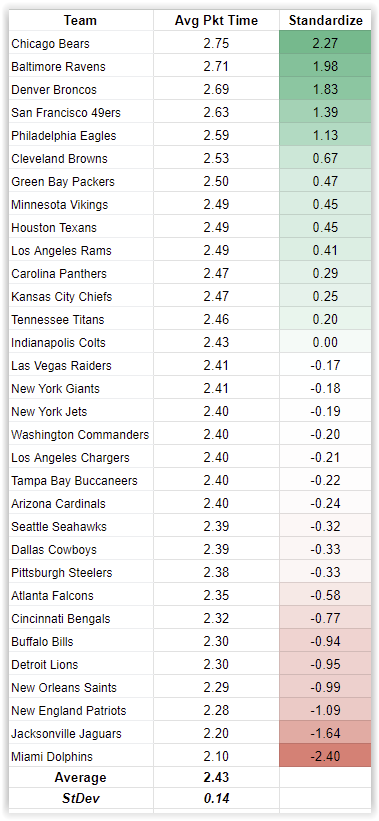
Average Time in The Pocket – The amount of time the quarterback has before contact or being flushed is average time in the pocket. It should follow that allowing more time for the quarterback would be good, and allowing less time bad.
This is a bit of scheming that plays into this as some times have an extremely quick read system that inherently gets the ball out faster than other schemes looking for deeper, or double, routes. But it is a fairly reliable indicator on the ability of the line to pass protect and form a workable qb pocket.
Average Pocket Time Ratings & Rankings
Using StDev allows us to easily segment performance by SD units.
With an Average of 2.43 StDev of 0.14 we can use the following as a guide:
Exceptional 2.72+
Very Good to Great 2.58 to 2.71
Average to Very Good 2.43 to 2.57
Poor to Average 2.29 to 2.43
Very Poor to Poor 2.15 to 2.28
Dismal 2.14 & Below
Top 5 Teams – Average Pocket Time
- Chicago (2.27)
- Baltimore
- Denver
- San Francisco
- Philadelphia
Bottom 5 Teams – Average Pocket Time
28. Detroit
29.New Orleans
30. New England
31. Jacksonville
32. Miami (-2.40)
Sack % Allowed – Sacks are the worst kind of pressure as they come with loss of down and yardage by the very definition of a sack. This is an inverse metric in that it is better to have a lower sack % than a higher one. Lines that allow a lower % of sack will score well, while porous lines will score poorly.
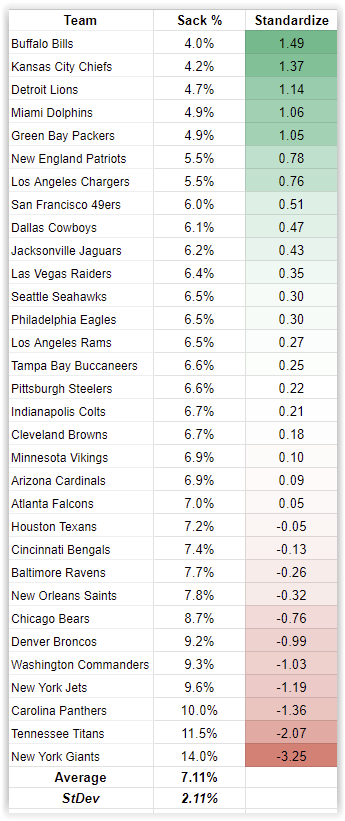
Sack% Allowed Ratings & Rankings
Using StDev allows us to easily segment performance by SD units.
With an Average of 7.11% StDev of 2.11% we can use the following as a guide:
Exceptional 2.88% & Below
Great to Very Good 2.89% to 4.99%
Very Good to Average 5.00% to 7.11%
Average – Poor 7.11% to 9.22%
Poor to Very Poor 9.23% to 11.33%
Dismal 11.34%+
Top 5 Teams – Sack % Allowed
- Buffalo
- Kansas City
- Detroit
- Miami
- Green Bay
Bottom 5 Teams – Sack % Allowed
28. Washington
29. NY Jets
30. Carolina
31. Tennessee (-2.07)
32. NY Giants (-3.25)
Minimize Penalties
Another metric in measuring offensive lines will be their ability to avoid getting in their own way. Every penalty on each individual line is collected and the entire line is responsible for the total penalties.
For estimating penalty yardage, a false start is 5 yards, holding and any other penalty is 10 yards(the other penalties are a mix of 5 yard and 15 yard infractions, thus I decided to use 10 yards as the punishement for each. Offsetting and declined penalties are still counted. Multiplier out the types of penalties and the estimated yardage for each results in an estimated total penalty yardage total for each offensive line. This is also an inverse metric. Lines that have been penalized the most will score poorly, while the mistake free lines will score high.
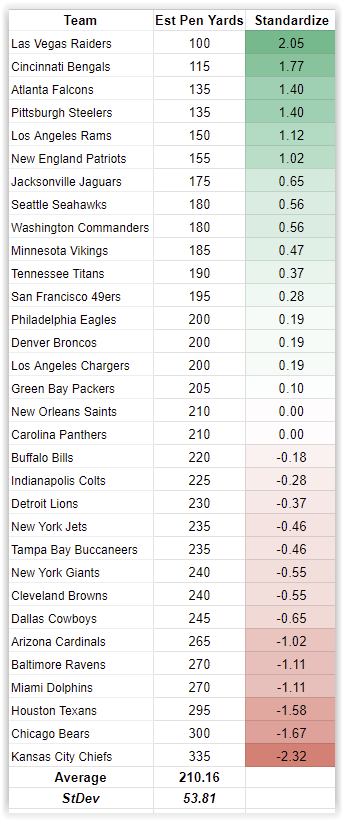
Offensive Line Penalty Yardage Ratings & Rankings
Using StDev allows us to easily segment performance by SD units.
With an Average of 210 StDev of 54 we can use the following as a guide:
Exceptional 105 & Below
Great to Very Good 155 – 106
Very Good to Average 156 to 210
Average – Poor 210 to 264
Poor to Very Poor 265 to 319
Dismal 320 & Above
Top 5 Teams – Offensive Line Penalty Yardage
- Las Vegas (2.05)
- Cincinnati
- Atlanta
- Pittsburgh
- L.A. Rams
Bottom 5 Teams – Offensive Line Penalty Yardage
28. Baltimore
29. Miami
30. Houston
31. Chicago
32. Kansas City (-2.32)
Winning Blocks – Overall Offensive Line Blocking Win Rate
The final metric is another metric you may not have seen before, Overall Block Win Rate. To calculate this metric, ESPN’s Pass Blocking Win Rate and Rush Blocking Win Rate percentages were used for each team.
Then the breakdown between passing and running plays for each team were taken into account. To find the overall block win rate, the pass block win rate was multiplied by the passing play %, and the rush block win rate was multiplied by the rush play %. Turning the resulting metric back into a percentage, leads to overall block win rate.
For example, a team has a pass block win rate of 60% and a rush block win rate of 70%. They pass 60% of the time and run 40% of the time. What is the overall block win %?
Overall Block Win % = [(0.60*60)+(0.70*40)]/100 = 64%
You can see all the data and calculation in the main chart. Perhaps you think everything before this section is nonsense and overall block win rate % is the true measure of offensive lines. In that case, here is the ranking based solely on Overall Block Win Rate %
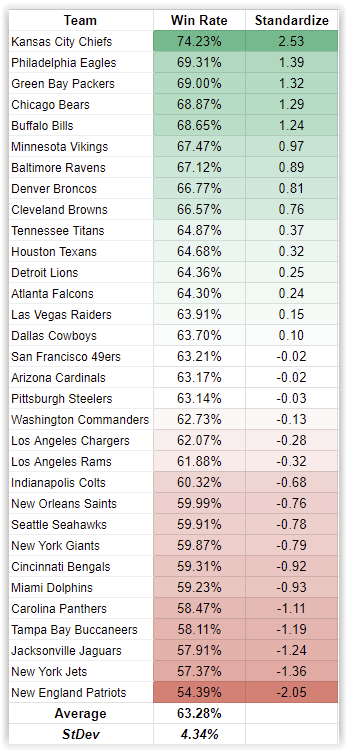
Overall Block Win Rate % Ratings & Rankings
Using StDev allows us to easily segment performance by SD units.
With an Average of 63.28% StDev of 4.34% we can use the following as a guide:
Exceptional 71.98%+
Very Good to Great 67.63% to 71.97%
Average to Very Good 63.28% to 67.62%
Poor to Average 58.94% to 63.28%
Very Poor to Poor 54.60% to 58.93%
Dismal 54.59% & Below
Top 5 Teams – Overall Block Win %
- Kansas City (2.53)
- Philadelphia
- Green Bay
- Chicago
- Buffalo
Bottom 5 Teams – Overall Block Win %
28. Carolina
29. Tampa Bay
30. Jacksonville
31. NY Jets
32. New England (-2.05)
Pass Block Win Rate
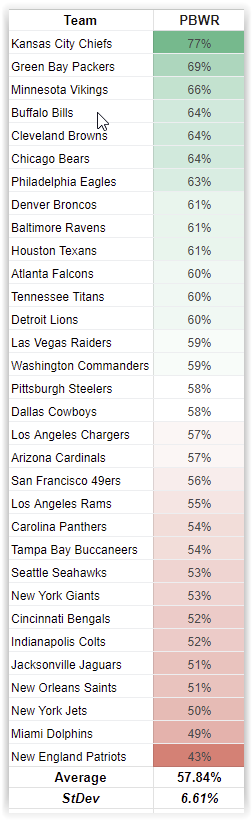
Pass Block Win Rate % Ratings & Rankings
Using StDev allows us to easily segment performance by SD units.
With an Average of 57.84% StDev of 6.61% we can use the following as a guide:
Exceptional 71.07%+
Very Good to Great 64.46% to 71.06%
Average to Very Good 57.84% to 64.45%
Poor to Average 51.23% to 57.84%
Very Poor to Poor 44.62% to 51.22%
Dismal 44.61% & Below
Top 5 Teams – Pass Block Win %
- Kansas City (2.90)
- Green Bay
- Minnesota
- Buffalo
- Cleveland
Bottom 5 Teams – Pass Block Win %
28. Jacksonville
29. New Orleans
30. NY Jets
31. Miami
32. New England (-2.24)
Run Block Win Rate
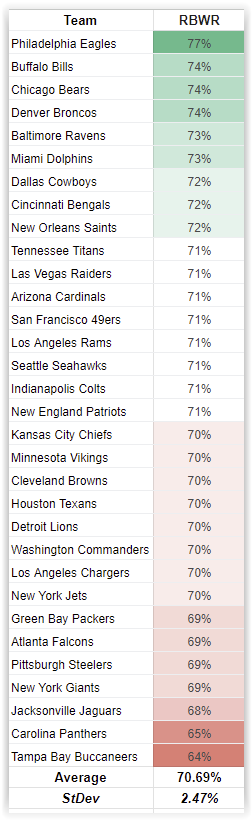
Run Block Win Rate % Ratings & Rankings
Using StDev allows us to easily segment performance by SD units.
With an Average of 70.69% StDev of 2.47% we can use the following as a guide:
Exceptional 75.64%+
Very Good to Great 73.17% to 75.63%
Average to Very Good 70.69% to 73.16%
Poor to Average 68.22% to 70.69%
Very Poor to Poor 65.75% to 68.21%
Dismal 65.74% & Below
Top 5 Teams – Run Block Win %
- Philadelphia (2.55)
- Buffalo
- Chicago
- Denver
- Baltimore
Bottom 5 Teams – Run Block Win %
28. Pittsburgh
29. NY Giants
30. Jacksonville
31. Carolina (-2.30)
32. Tampa Bay (-2.70)
Play Selection
Teams That Pass The Most
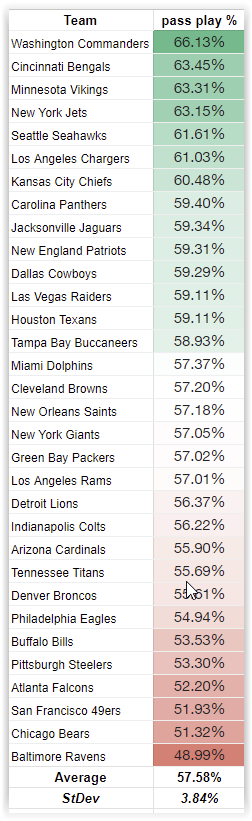
Passing Rate % Ratings & Rankings
Using StDev allows us to easily segment performance by SD units.
With an Average of 57.58% StDev of 3.84% we can use the following as a guide:
Exceptionally Above Average 65.27%+
Significantly Above Average 61.43% to 65.26%
Above Average 57.58% to 61.42%
Below Average 53.74% to 57.58%
Significantly Below Average 49.90% to 53.73%
Exceptionally Below Average 49.89% & Below
Top 5 Teams – Passing Rate %
- Washington (2.22)
- Cincinnati
- Minnesota
- NY Jets
- Seattle
Bottom 5 Teams – Passing Rate %
28. Pittsburgh
29. Atlanta
30. San Francisco
31. Chicago
32. Baltimore (-2.23)
Teams That Run The Most
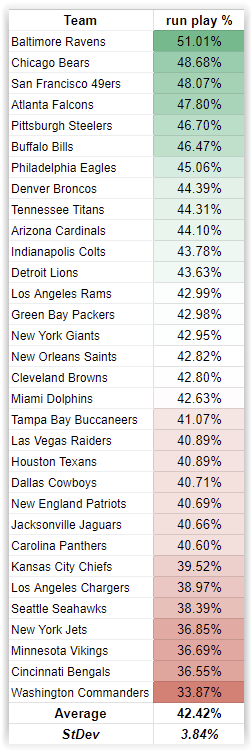
Rushing Rate % Ratings & Rankings
Using StDev allows us to easily segment performance by SD units.
With an Average of 42.42% StDev of 3.84% we can use the following as a guide:
Exceptionally Above Average 50.11%+
Significantly Above Average 46.27% to 50.10%
Above Average 42.42% to 46.26%
Below Average 38.58% to 42.42%
Significantly Below Average 34.74% to 38.57%
Exceptionally Below Average 34.73% & Below
Top 5 Teams – Rushing Rate %
- Baltimore (2.23)
- Chicago
- San Francisco
- Atlanta
- Pittsburgh
Bottom 5 Teams – Rushing Rate %
28. Seattle
29. NY Jets
30. Minnesota
31. Cincinnati
32. Washington (-2.22)
Final Offensive Line Ratings & Rankings
Summing up the score from the 8 metrics(and doubling the YBC value), we arrive at a final rating for each of the 32 offensive lines. Like any rating system there are sure to be disagreements in the methodology. However it did seem to correctly identify the best and worse of the offensive line play in 2023.
The Offensive Line Ratings see Baltimore, Philadelphia, Green Bay & The LA Rams as the having the best offensive lines. It sees Tennessee, Carolina, NY Giants & NY Jets as having the worst performing offensive lines in 2023.
As with all the ratings and analysis, feel free to chime in via the post on Reddit/r/nfl, Practicalist on Reddit, or by sending an email. Until next week, enjoy the football and best of luck to your team.