Ranking The 57 Super Bowls Games – The Most Offensive, Defensive & Best Overall Super Bowl
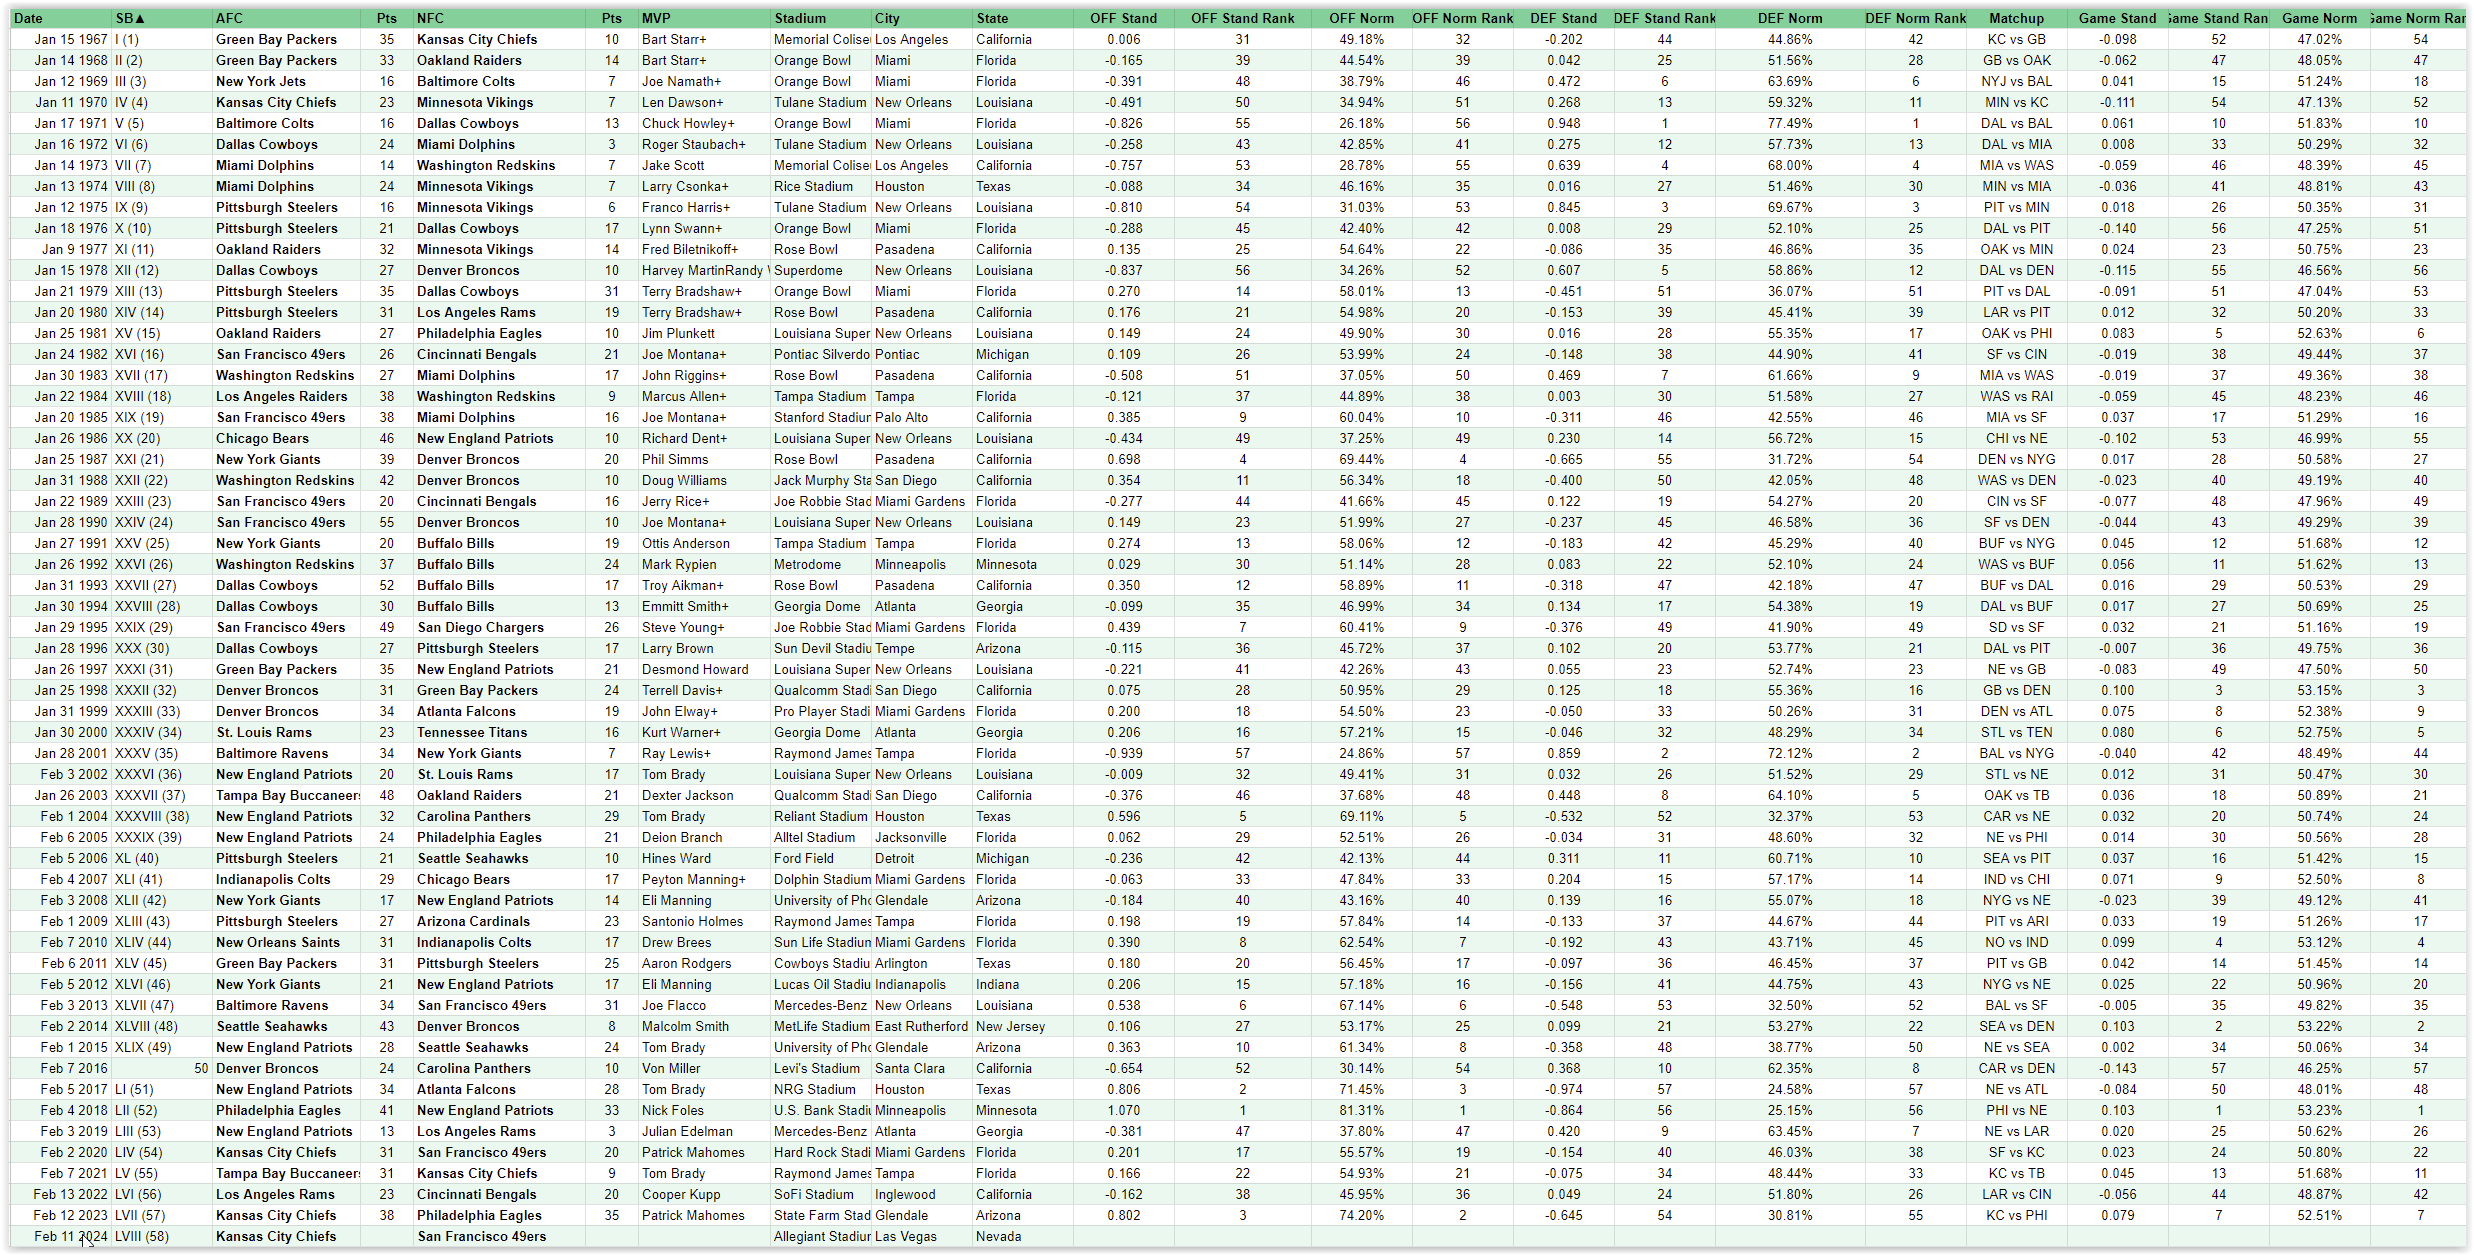
Let’s try ranking the Super Bowl games themselves by most/least offensive, defensive and best/worst Super Bowl game overall. To do this we are going to use the combined team ratings for each Super Bowl matchup. Basically these rankings should show us which games were filled or devoid of offense, were defensive slugfests, and were exciting games one way or another.
Read More: Ranking The 57 Super Bowls Teams – The Best & The Worst Offense, Defense & Team Performances
Keep in mind this is just a statistical exercise with an algorithm, not a human, determining the final rankings and ratings. As such, it is going to be imperfect. The algorithm has no feelings or bias so don’t take offense, or too much praise, from anything these rankings say about your favorite team.
57 Super Bowls – The Best & Worst Super Bowl Games
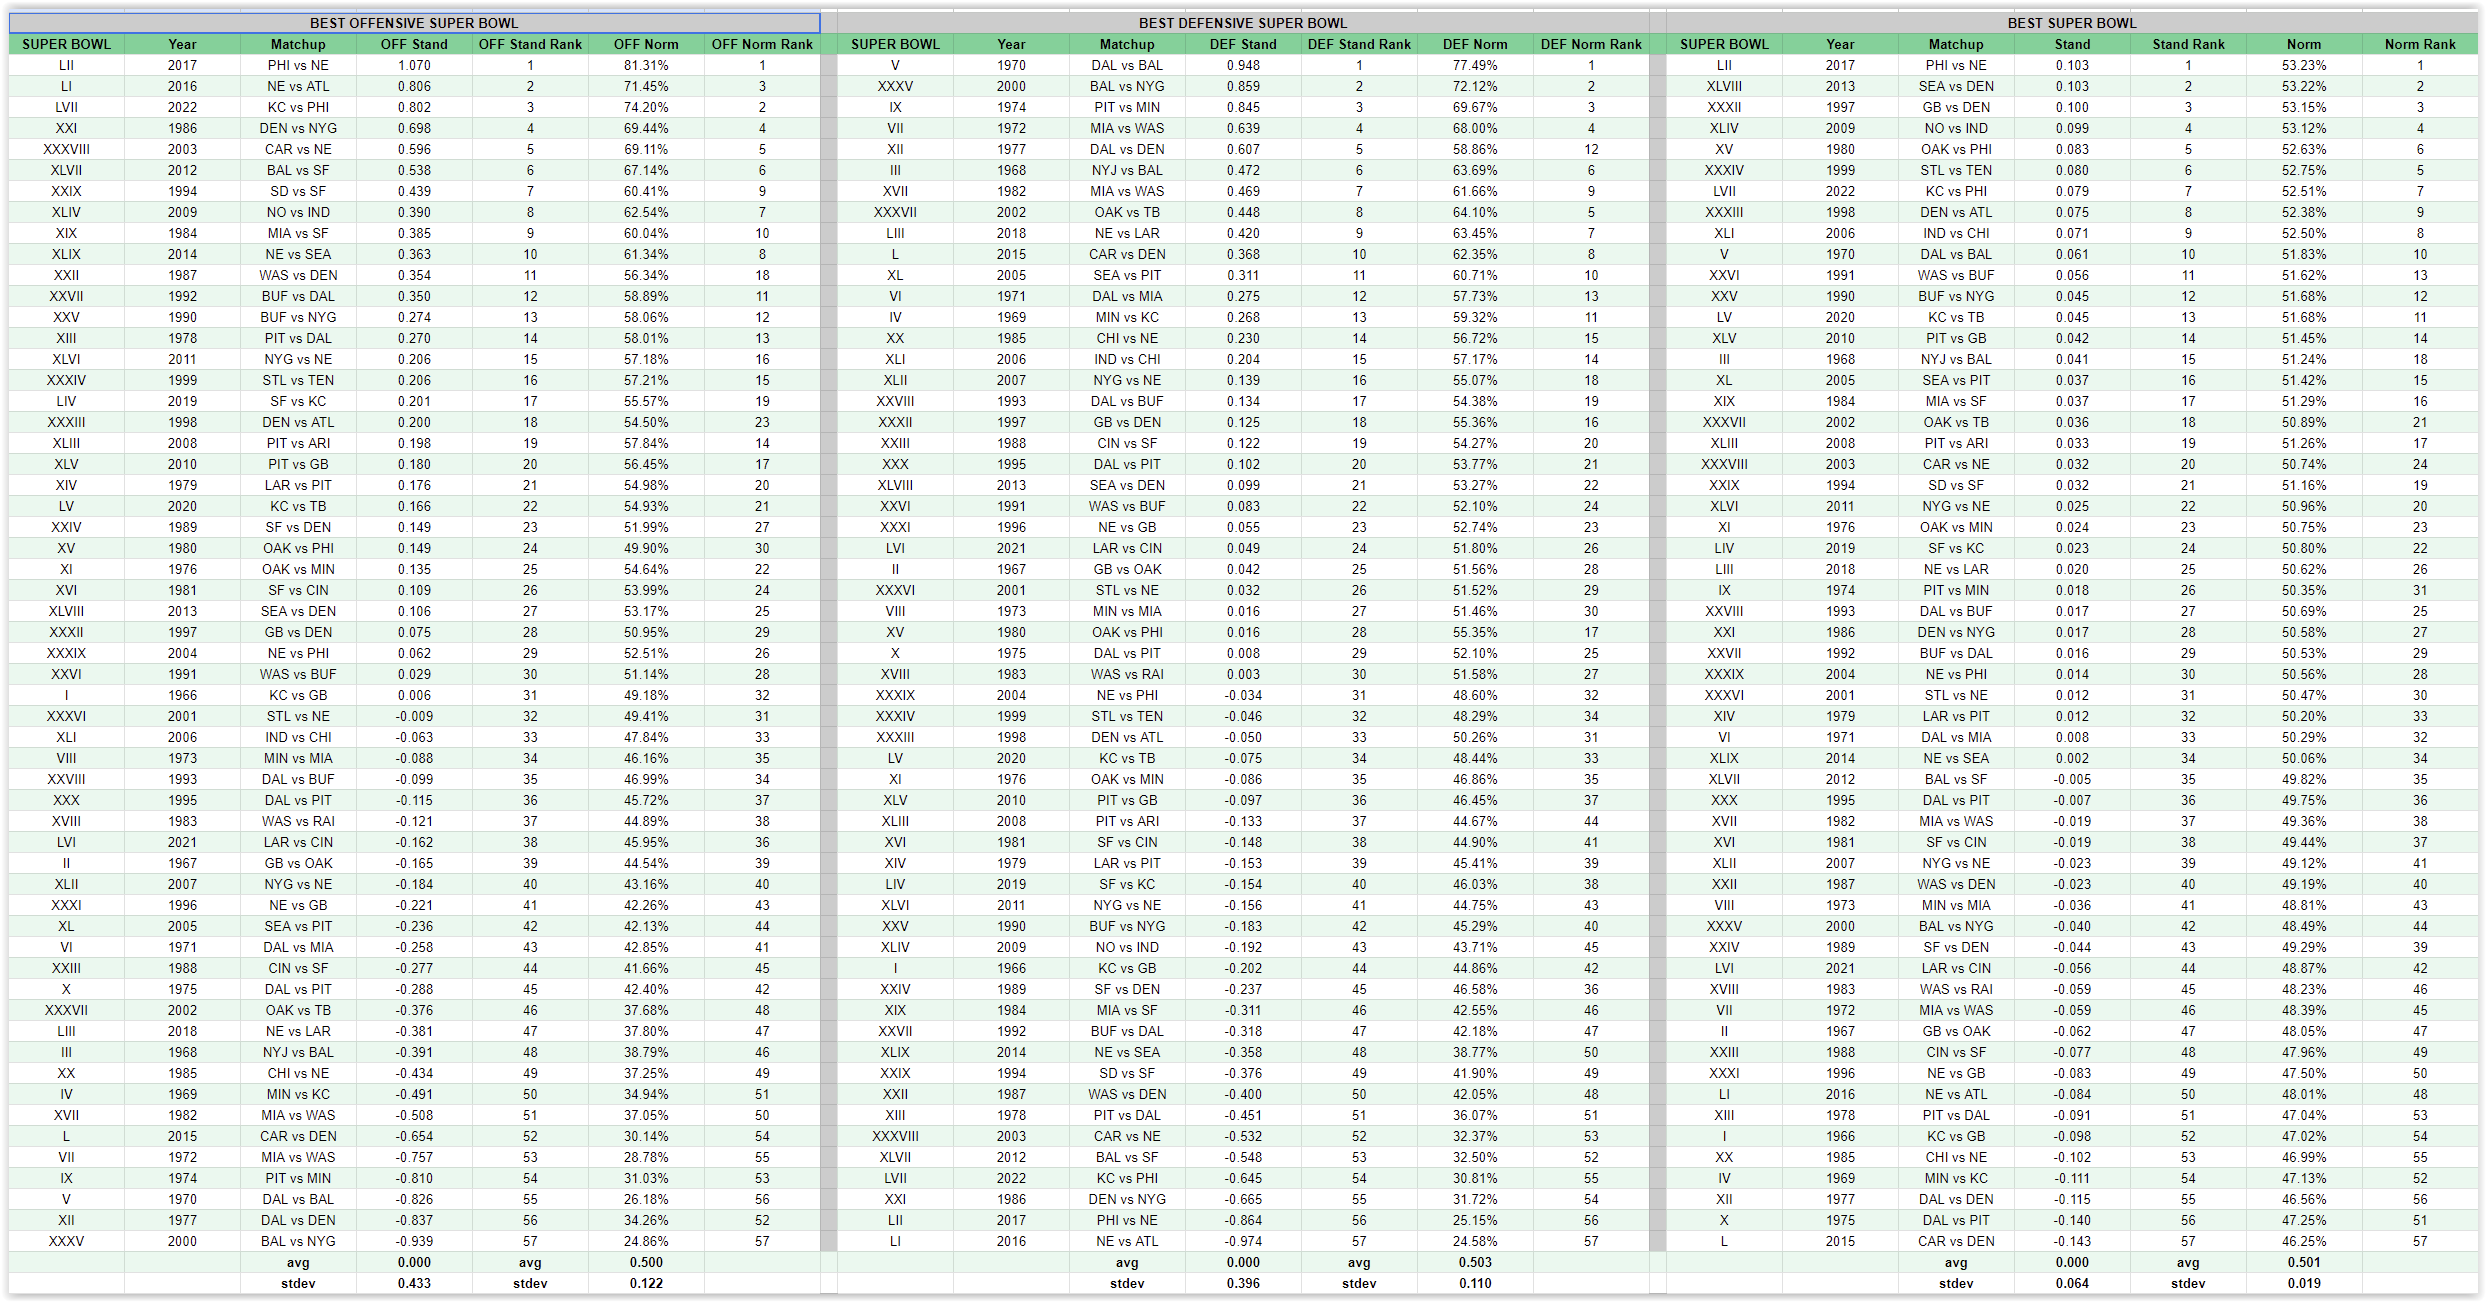
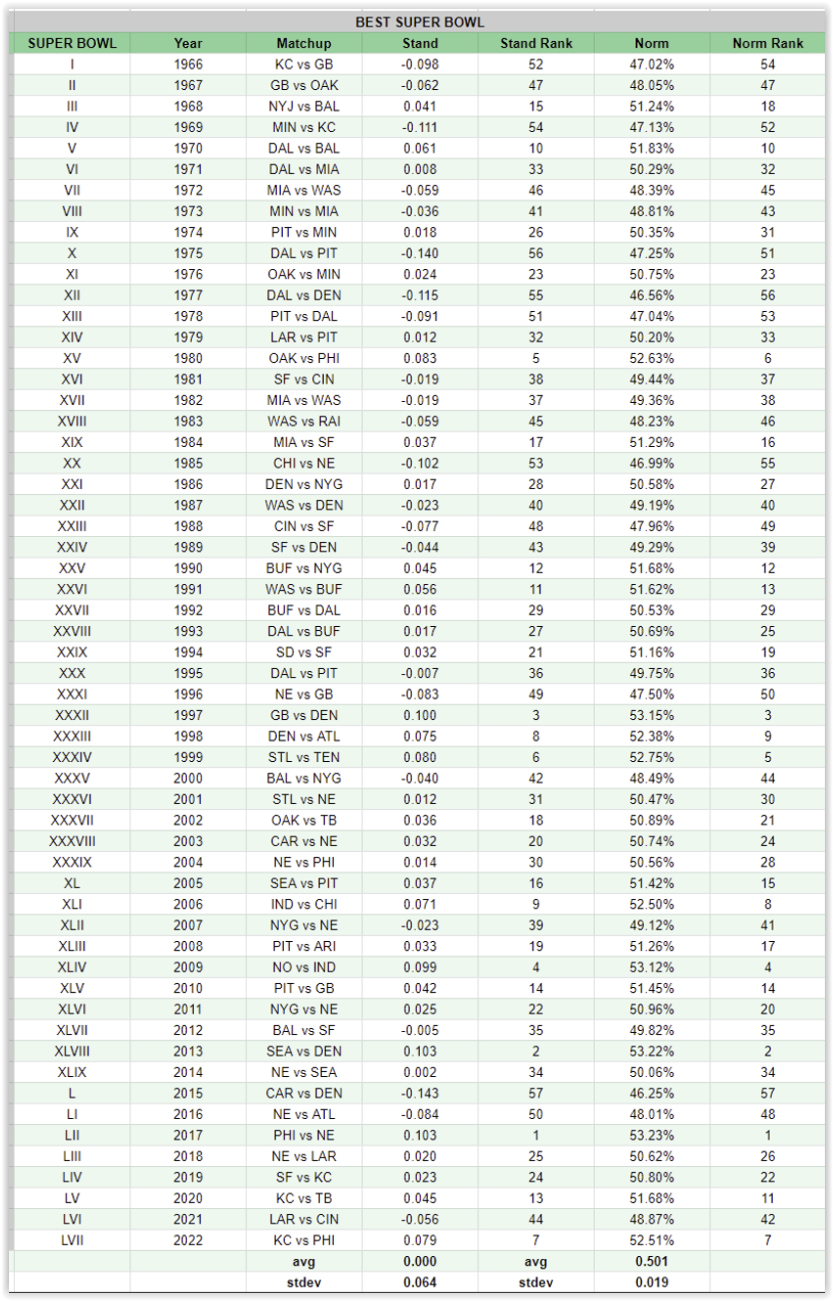
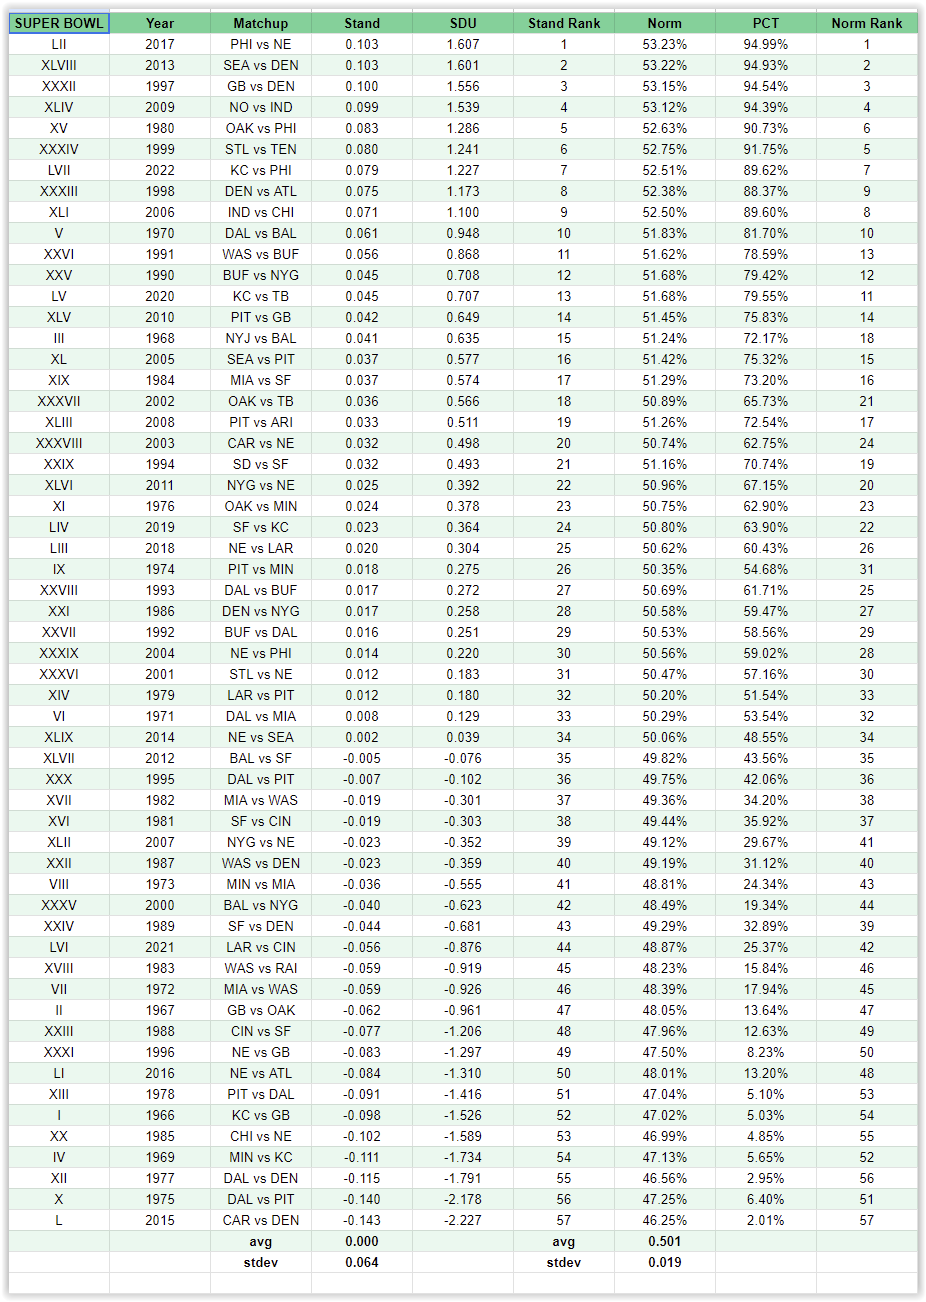
Using each teams offensive and defensive ratings, we can score the Super Bowl games itself. The final rankings are amazingly close, just 0.25 standard deviation units seperates the #1 game from the #57 game. On the normalization side the #1 game scored a 53.23% while game #57 scored a 46.25%. The box score is include for the Top 10 & Botom 10 games.
Host A Super Bowl LVIII Prop Bets Sheet Pool Party – Printable PDF
Super Bowl 58 LVIII Prop Sheet Bets – Host a Super Bowl 2024 Prop Bets Pool Party
Top 10 – Best Super Bowl Games
- 2017 Philadelphia 41 vs New England 33
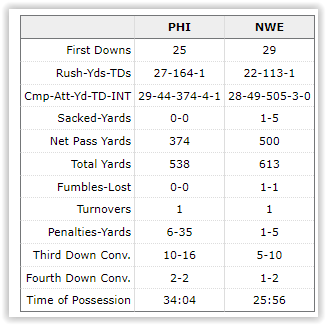
Super Bowl LII Philadelphia vs New England Stats - 2013 Seattle 43 vs Denver 8
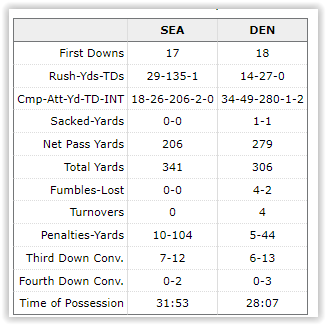
Super Bowl XLVIII Seattle vs Denver Stats - 1997 Green Bay 24 vs Denver 31
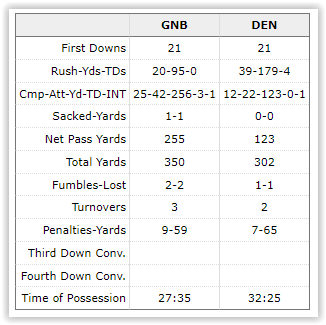
Super Bowl XXXII Denver vs Green Bay Stats - 2009 New Orleans 31 vs Indianapolis 17
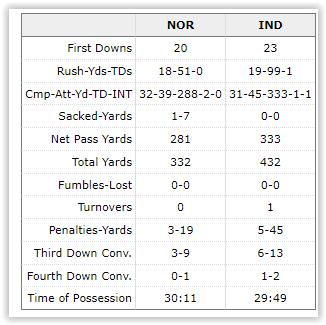
Super Bowl XLIV New Orelans vs Indianapolis Stats - 1980 Oakland 27 vs Philadelphia 10
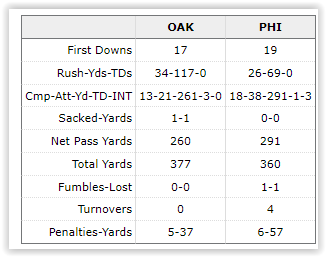
Super Bowl XV Oakland vs Philadelphia Stats - 1999 St Louis 23 vs Tennessee 16
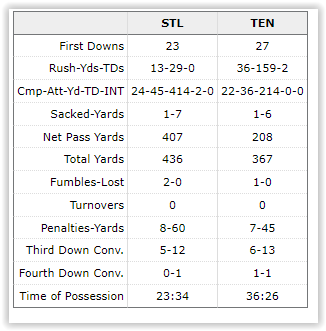
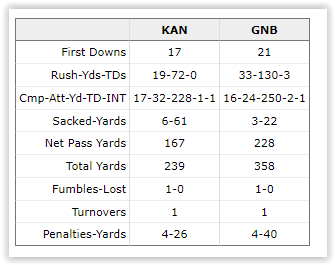
Super Bowl XXXIV St Louis vs Tennessee Stats - 2022 Kansas City 38 vs Philadelphia 35
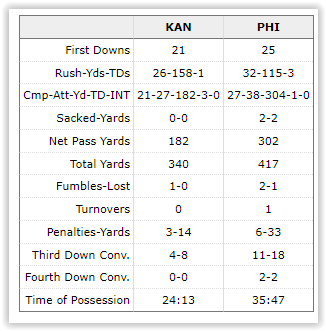
Super Bowl LVII Kansas City vs PhiladelphiaStats - 1998 Denver 34 vs Atlanta 19
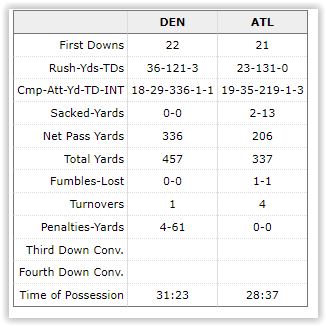
Super Bowl XXXIII Denver vs Atlanta Stats - 2006 Indianapolis 29 vs Chicago 17
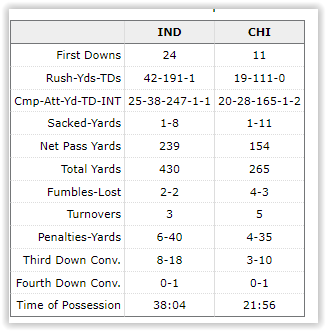
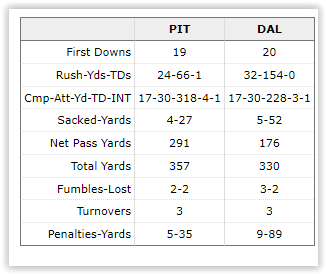
Super Bowl XLI Indianapolis vs Chicago Stats - 1970 Dallas 13 vs Baltimore 16
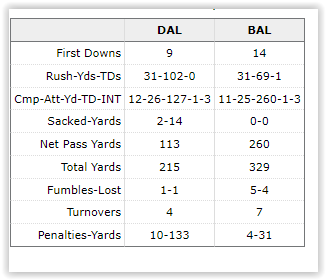
Super Bowl V Dallas vs Baltimore Stats
Well, with the exception of #2, the Seattle drubbing of the Broncos, and #5 Oakland’s demolition of the Eagles, the Top 10 list isn’t that bad. There are far more bad Super Bowls than good ones as far as competitive games go. While most of the games would be modern NFL Super Bowls, the algorithm did find the 1970 Super Bowl V a top 10 game. A game that featured a whopping 11 turnovers.
Bottom 10 – Worst Super Bowl Games
- 2015 Carolina 10 vs Denver 24
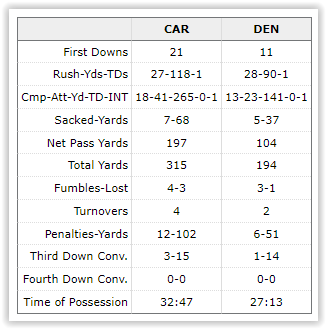
Super Bowl 50 Carolina vs Denver Stats - 1975 Dallas 17 vs Pittsburgh 21
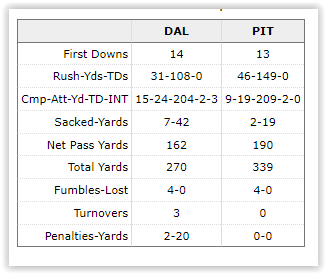
Super Bowl X Pittsburgh vs Dallas Stats - 1977 Dallas 27 vs Denver 10
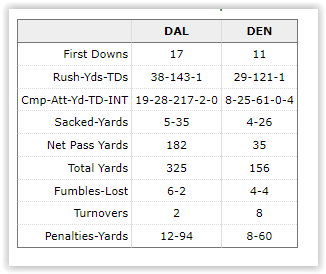
Super Bowl X II Dallas vs Denver Stats - 1969 Minnesota 7 vs Kansas City 23
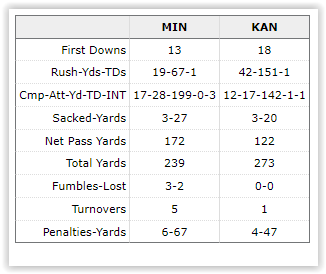
Super Bowl IV Minnesota vs Kansas City Stats - 1985 Chicago 46 vs New England 10
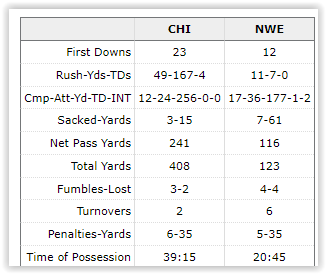
Super Bowl XX Chicago vs New England Stats - 1966 Kansas City 10 vs Green Bay 35
Super Bowl I Box Score Kansas City vs Green Bay - 1978 Pittsburgh 35 vs Dallas 31
Super Bowl XIII Pittsburgh vs Dallas Stats - 2016 New England 34 vs Atlanta 28
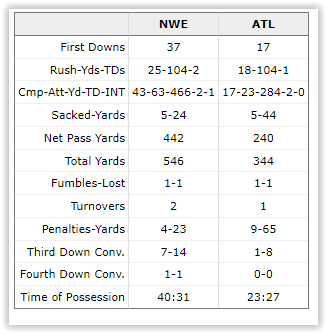
Super Bowl LI New England vs Atlanta Stats - 1996 New England 21 vs Green Bay 35
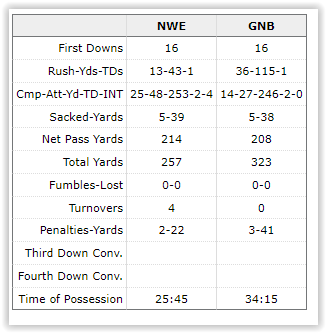
Super Bowl XXXI New England vs Green Bay Stats - 1988 Cincinnati 16 vs San Francisco 20
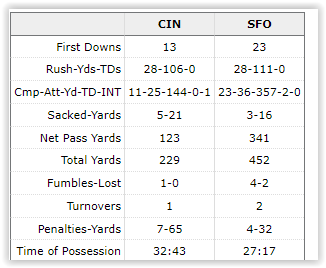
Super Bowl XXIII Cincinnati vs San Francisco Stats
Reviewing the Bottom 10 Games
In the bottom 10 list, #2 1977 Dallas vs Pittsburgh, #7 1978 Pittsburgh vs Dallas, & #10 1988 Cincinnati vs San Francisco would seem to be questionable at best. There does seem to be a trend of a lot of turnovers in these bottom 10 games. A rough count comes up with 53 turnovers in the 10 games; 10 turnovers in the 1977 game, 8 in 1985, 6 in 1978, 1969, & 2015, that’s 36 turnovers in those 5 games alone.
The most questionable selection would proabably be the #8 pick of New England vs Atlanta. That game featured a tale of two halves as Atlanta sprinted out to a 28-3 halftime lead only to lose 34 – 38 in OT. If each half itself were a game, they would both score poorly like most drubbings. The stats just balanced out in a way that compared poorly to other games even though a Super Bowl with OT would probably be very exciting. I suppose the argument is that the game was a sleeper up until the Patriots got within one score or tied it, and then it became a good game.
Best Super Bowls By Year 1966 – 2022
Standard Deviation Scale
Here is a simple breakdown for standard deviation units(SDU)
Outstanding = 2.00+
Good To Great = 1.01+ thru 2.00
Average to Good = 0.00 thru 1.00
Average to Poor = 0.00 thru -1.00
Poor to Very Poor = -1.01 thru -2.00
Abysmal = -2.01 & Below
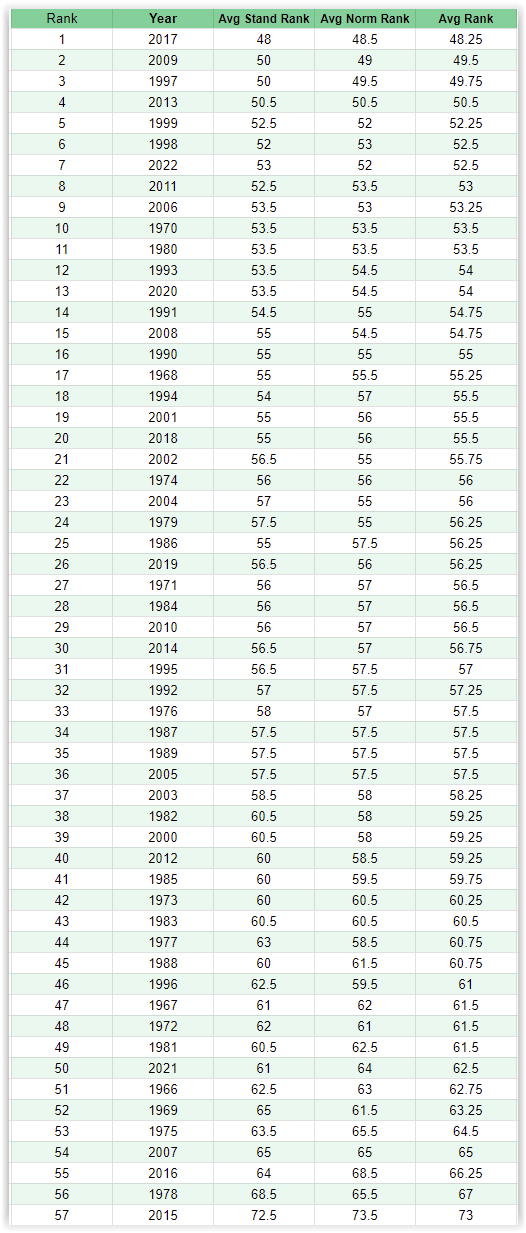
Ranking Super Bowl Games By Avg Standardization & Normalization Ranks
57 Super Bowls – Which Featured The Most Offense
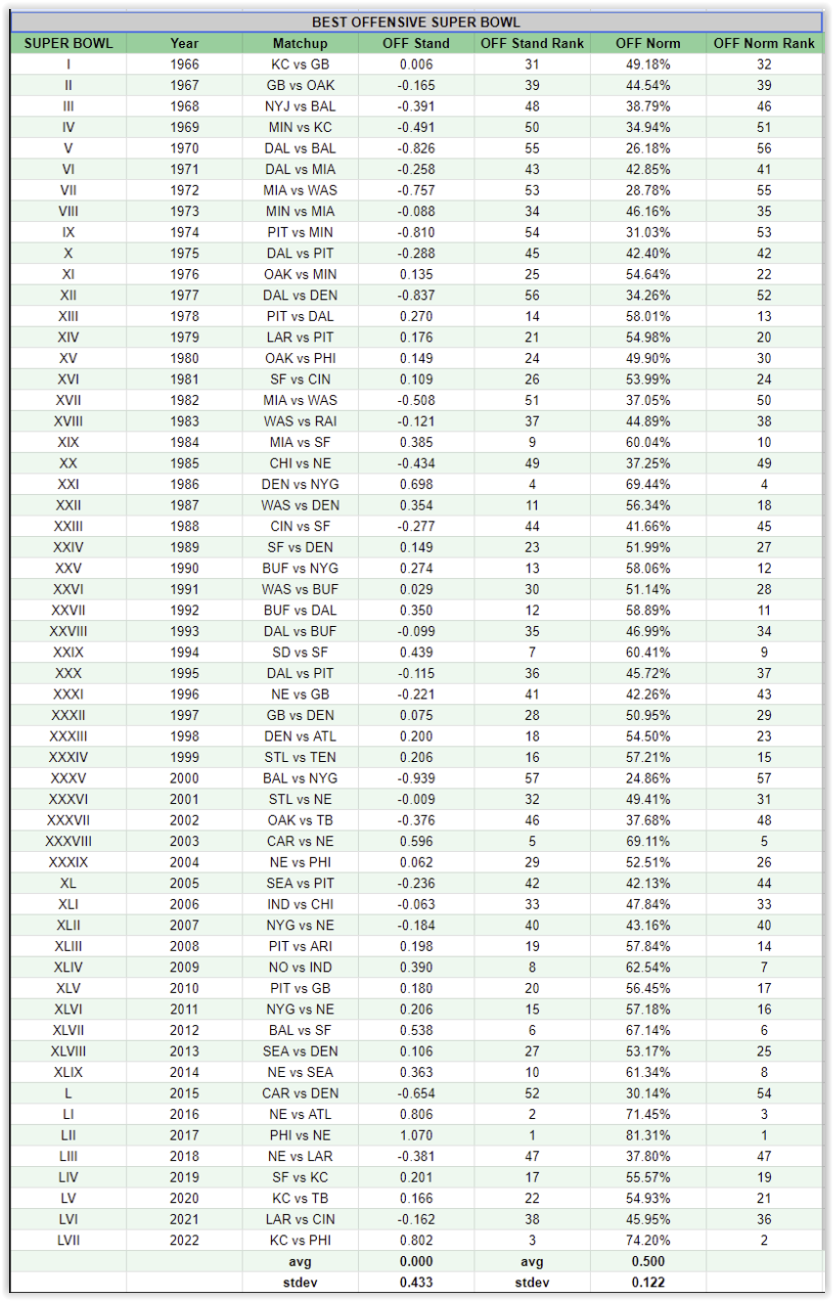
Clearly this list is going to be impacted by history. The modern NFL game is much more offensive than the one played 30-40 years ago. We should expect to see the more recent Super Bowls in the Most Offensive Top 10 & more teams from the 60’s and 70’s in the list of Most Defensive Super Bowls.
When it comes to Best Super Bowl Game Overall, it should be interesting to see how the Algorithm sorts out the two types of games played and which were “the best”, at least in the eyes of a statistical algorithm.
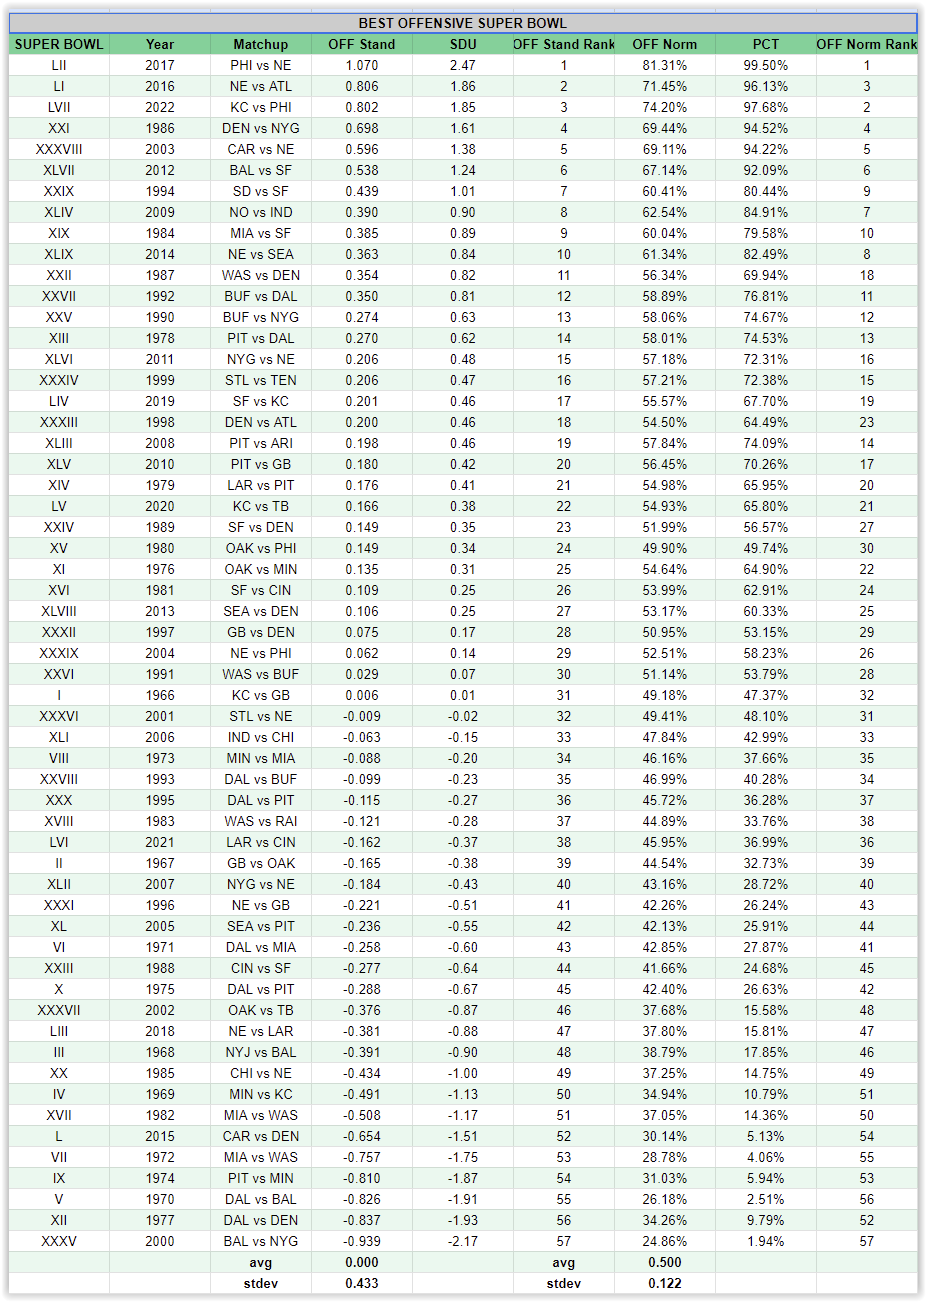
Top 10 – Best Offensive Super Bowl Games
- 2017 Philadelphia vs New England
- 2016 New England vs Atlanta
- 2022 Kansas City vs Philadelphia
- 1986 Denver vs NY Giants
- 2003 Carolina vs New England
- 2012 Baltimore vs San Francisco
- 1994 San Diego vs San Francisco
- 2009 New Orleans vs Indianapolis
- 1984 Miami vs San Francisco
- 2014 New England vs Seattle
Bottom 10 – Worst Offensive Super Bowl Games
- 2000 Baltimore vs NY Giants
- 1977 Dallas vs Denver
- 1970 Dallas vs Baltimore
- 1974 Pittsburgh vs Minnesota
- 1972 Miami vs Washington
- 2015 Carolina vs Denver
- 1982 Miami vs Washington
- 1969 Minnesota Kansas City
- 1985 Chicago New England
- 1968 NY Jets vs Baltimore
- 2018 New England vs LA Rams
Standard Deviation Scale
Here is a simple breakdown for standard deviation units(SDU)
Outstanding = 2.00+
Good To Great = 1.01+ thru 2.00
Average to Good = 0.00 thru 1.00
Average to Poor = 0.00 thru -1.00
Poor to Very Poor = -1.01 thru -2.00
Abysmal = -2.01 & Below
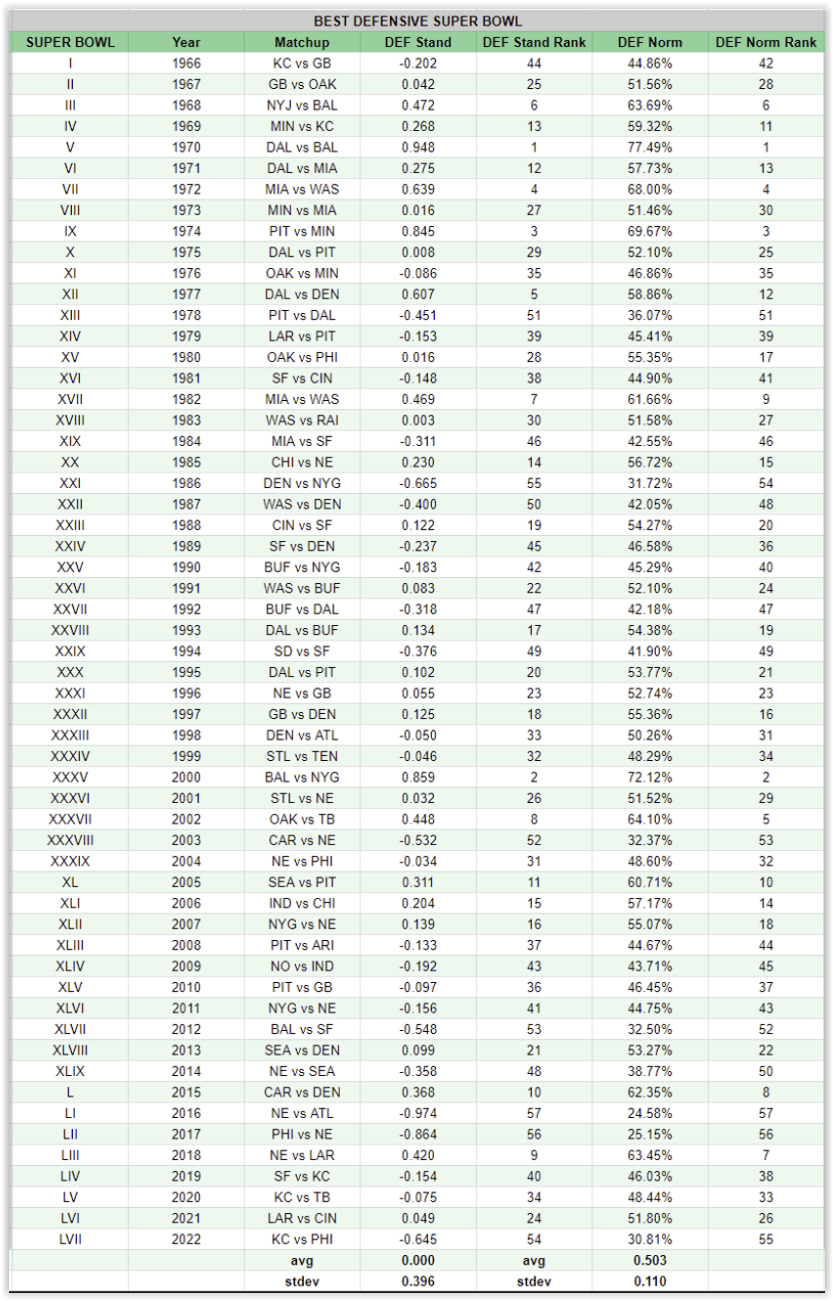
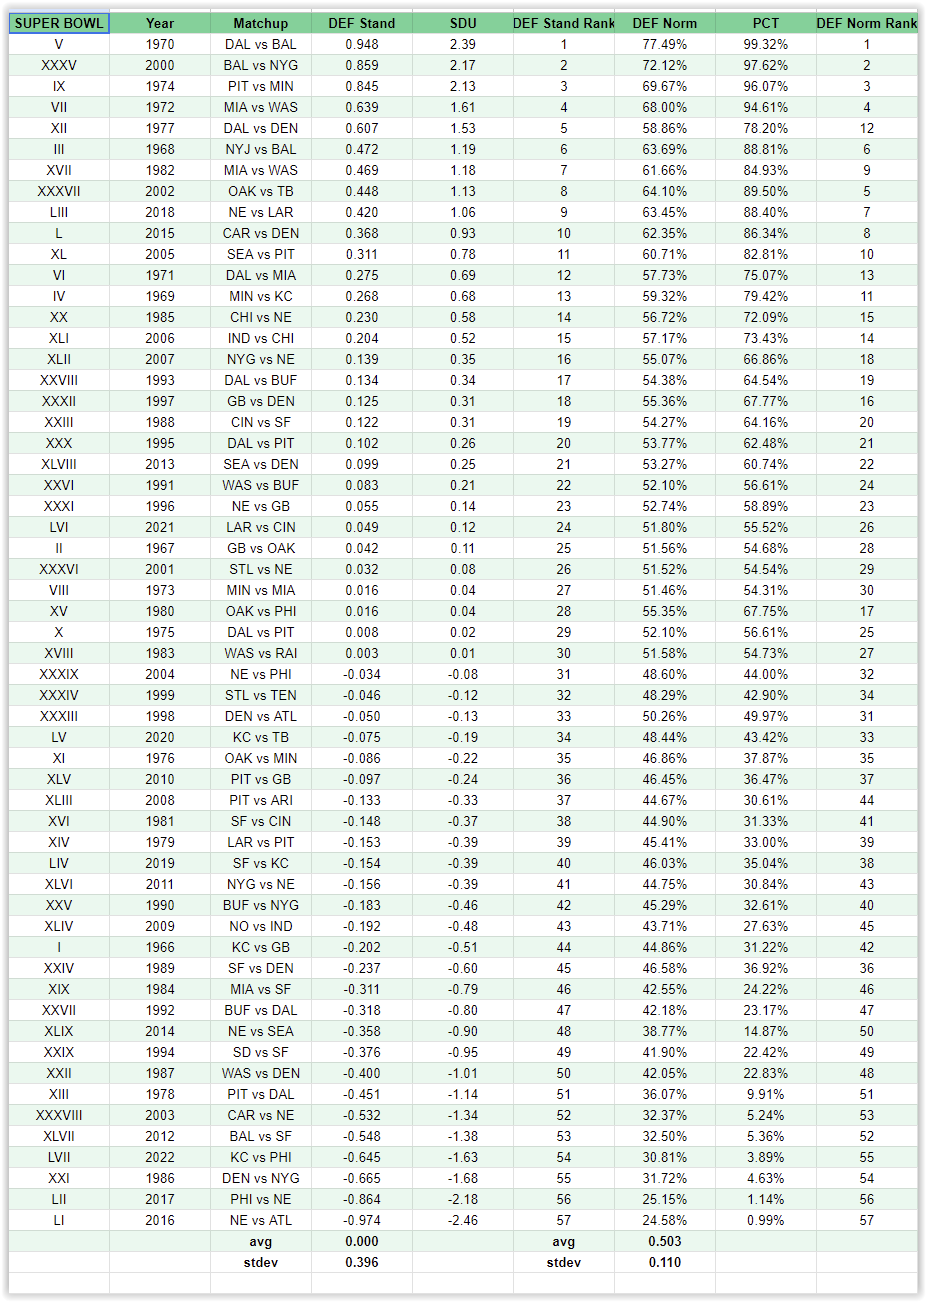
57 Super Bowls – Which Featured The Most Defense
We should see many of the teams from the bottom of the offensive game list here. The algorithm may also fill in the top defensive Super Bowl list with other games that featured a bit more offense but were dominated by defenses in general.
For the Bottom 10, we will see the top of the offensive list as well as a few other games that saw a general lack of defensive prowess.
Top 10 – Best Defensive Super Bowl Games
- 1970 Dallas vs Baltimore
- 2000 Baltimore vs NY Giants
- 1974 Pittsburgh vs Minnesota
- 1972 Miami vs Washington
- 1977 Dallas vs Denver
- 1968 NY Jets vs Baltimore
- 1982 Miami vs Washington
- 2002 Oakland vs Tampa Bay
- 2018 New England vs LA Rams
- 2015 Carolina vs Denver
Bottom 10 – Worst Defensive Super Bowl Games
- 2016 New England vs Atlanta
- 2017 Philadelphia vs New England
- 1986 Denver vs NY Giants
- 2022 Kansas City vs Philadelphia
- 2012 Baltimore vs San Francisco
- 2003 Carolina vs New England
- 1978 Pittsburgh vs Dallas
- 1987 Washington vs Denver
- 1994 San Diego vs San Francisco
- 2014 New England vs Seattle
Standard Deviation Scale
Here is a simple breakdown for standard deviation units(SDU)
Outstanding = 2.00+
Good To Great = 1.01+ thru 2.00
Average to Good = 0.00 thru 1.00
Average to Poor = 0.00 thru -1.00
Poor to Very Poor = -1.01 thru -2.00
Abysmal = -2.01 & Below
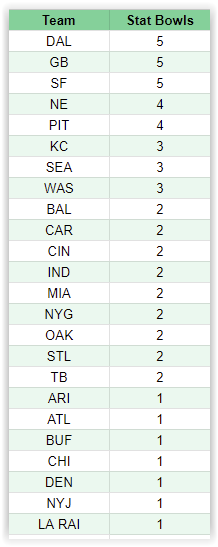
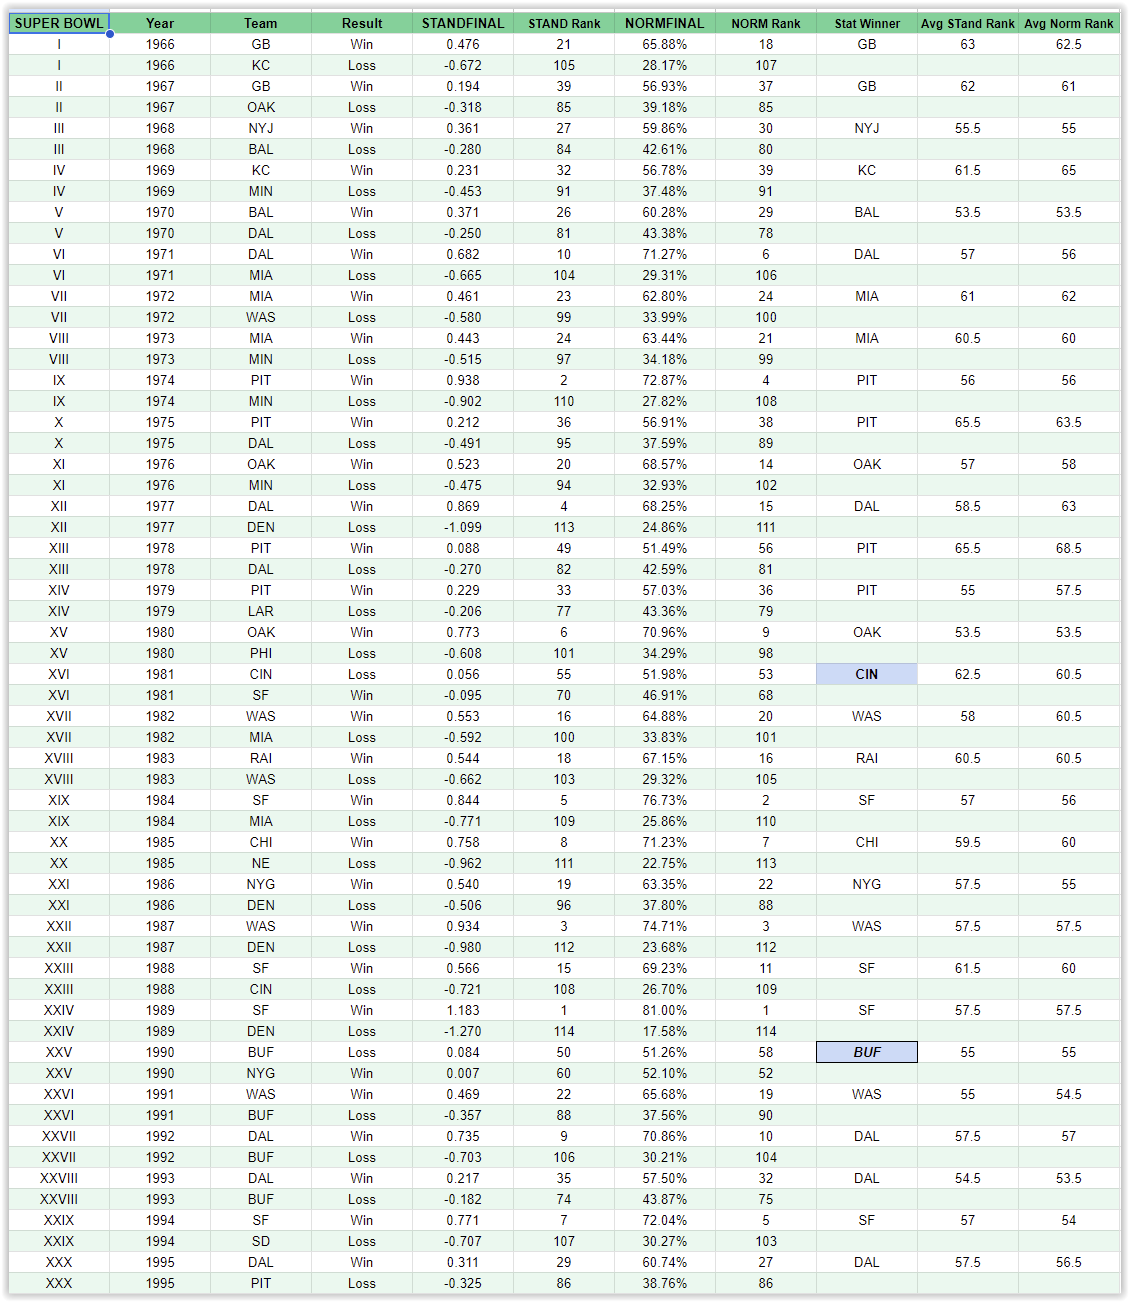
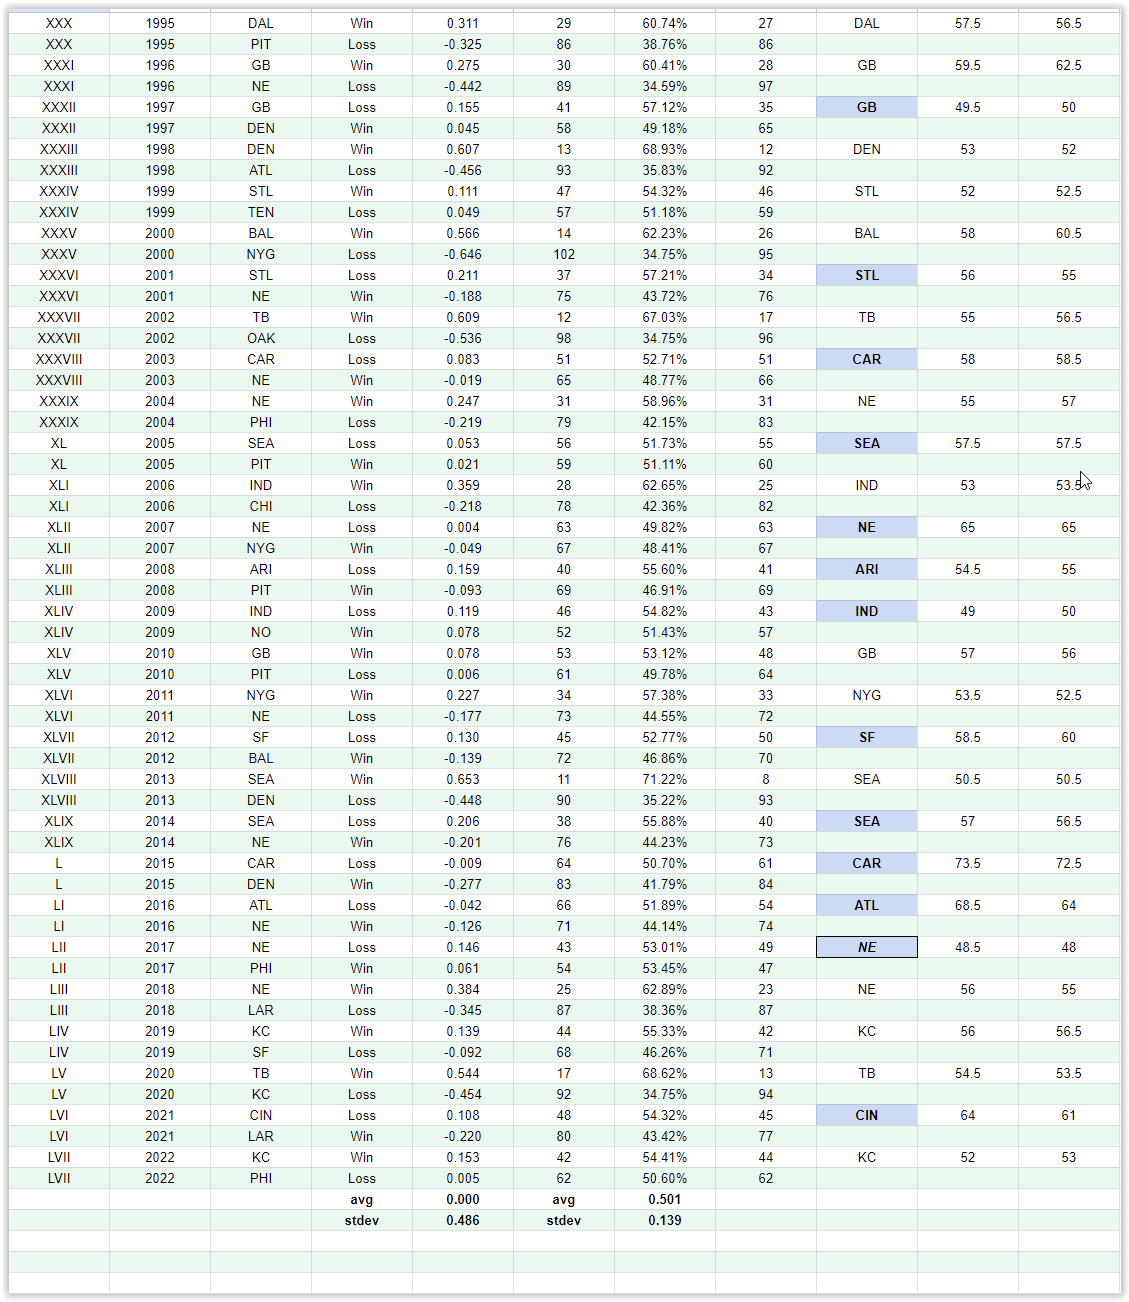
The Stat Bowl – Super Bowl Winners Based On Stats
One last little fantasy exercise to deal with. What if we used the stats from each Super Bowl team and game and declare the winner as the team that performed better statistically? Which Super Bowl champions would change?
In the Super Bowl Statistical Matchups below, you can see which team performed better on the day.
- Teams in bold & blue background were Super Losers who would have won the Stat Bowl
- Teams in bold & Italics are teams in which the Standardization & Normalization ranks splits their decision.
The Stat Bowl – Super Bowls Each Team Should Have Won
So if Super Bowls were won solely by statistics alone, here is the list of Super Bowl Championships each team would have won.