Ranking The 57 Super Bowls Teams – The Best & The Worst Offense, Defense & Team Performances
Ranking the Super Bowl Teams
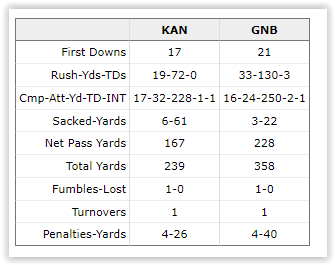
Let’s try ranking the 57 Super Bowls & 114 Super Bowl teams with comparative ratings using the single game Super Bowl game stats. We will look at each of the 114 teams’ offenses and defenses, so 228 units will be rated and ranked. There are some serious limitations to this excercise, namely that the statistics kept for the first 20 or so Super Bowls are limited to simple box scores. Here is the example from Super Bowl I:
Read More: Ranking The 57 Super Bowls Games – The Most Offensive, Defensive & Best Overall Super Bowl
So we are going to be limited to those statistics and whatever statistics we can create or generate from those stats. Furthermore, this will be the limit to every Super Bowl game as far as statistics. We can’t use newer statistics in more recent games and compare them to older games without those metrics.
In essense, we are going back to the stone age of football statistic gathering. However, those stats give us just enough firepower to get some metrics out of it, including more “sophisticated” stats like passer rating and ANY/As. We can also use the opponents statistics in a game and assign those stats to the defenses of each team. Whatever offense KC put up in SB I, it was Green Bay’s defense that was responsible.
Host A Super Bowl LVIII Prop Bets Sheet Pool Party – Printable PDF
Super Bowl 58 LVIII Prop Sheet Bets – Host a Super Bowl 2024 Prop Bets Pool Party

The Statistics & Metrics
With that being said, here are the 12 statistics used for each of the 114 offenses and defenses:
- Points For (Offense) OR Points Against (Defense)
- First Downs
- Total Yards
- Rush Yards / Attempt
- Rush TD %
- Completion %
- Yards / Attempt
- Pass TD %
- Interception %
- Sack %
- Passer Rating
- ANY/As
What we will do is use standardization and normalization to score each team in each of the 12 statistics. Teams are compared to each other so there is always a best and worst team for each metrics. Then we will add up and average the total scores for both Standization & Normalization leading to 2 final ratings and rankings. For consistency I tried to sort all the charts by Standardization Score, but the Normalization score is there as well if you prefer that measuring tool.
Here is the process:
- Get the average for the stat using the stats from all 57 games/114 teams.
- Get the standard deviation of the stat.
- Score each game/team using the standardization score & the normalization score.
- Sum up and average out the scores leading to a final ranking.
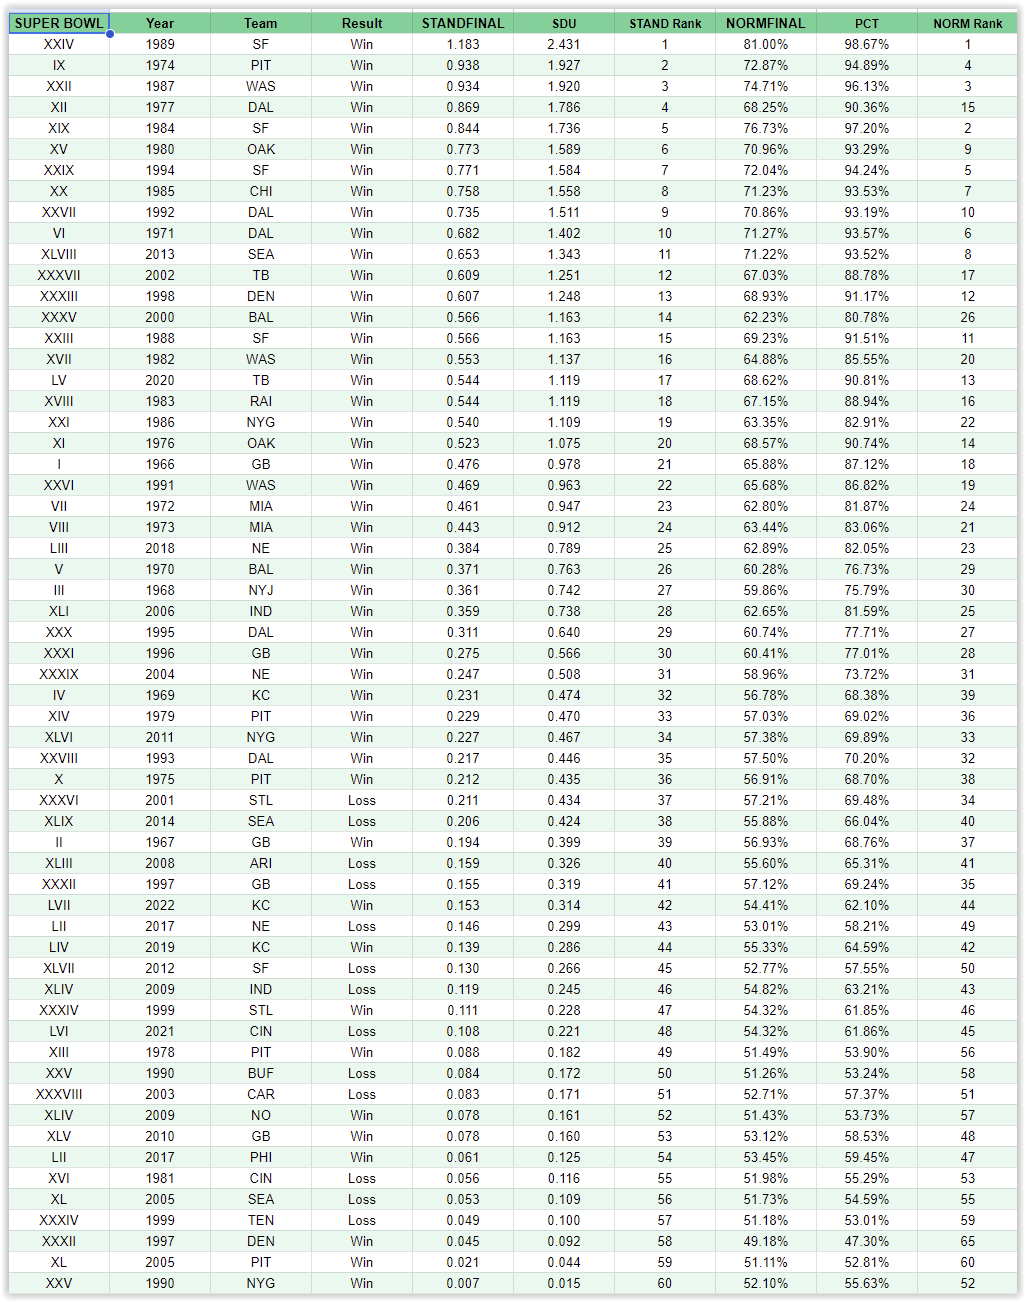
114 Super Bowl Teams – Ranked Best To Worst
Let’s preface this by saying the team and unit rankings don’t indicate the best or worst teams or units in NFL history, but rather the best and worst performances in the Super Bowl itself. Most, if not all, of the Super Bowl teams were good to great teams. What we are measuring or ranking here is the team’s performance in the Super Bowl vs other Super Bowl teams.
For the worst list, think of it more as teams who laid an egg in the Super Bowl as opposed to any comment on the quality of the team throughout the season or its place in history. Denver fans may want to shade their eyes….

Top 10 – Best Super Bowl Teams
- 1989 San Francisco 49ers
- 1974 Pittsburgh Steelers
- 1987 Washington Redskins
- 1977 Dallas Cowboys
- 1984 San Francisco 49ers
- 1980 Oakland Raiders
- 1994 San Francisco 49ers
- 1985 Chicago Bears
- 1992 Dallas Cowboys
- 1971 Dallas Cowboys
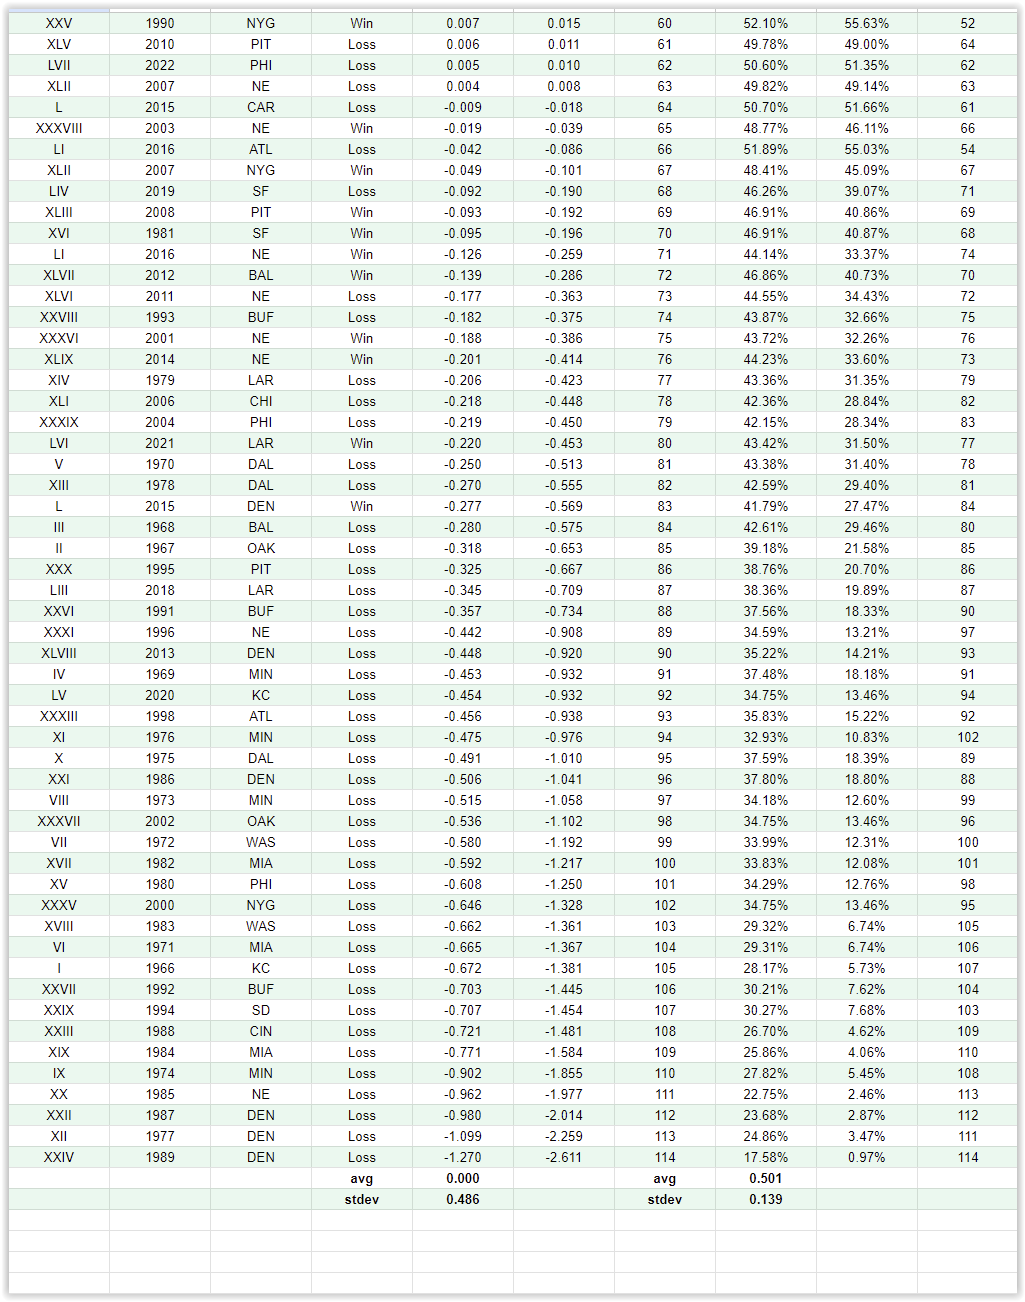
Bottom 10 – Worst Super Bowl Teams
- 1989 Denver Broncos
- 1977 Denver Broncos
- 1987 Denver Broncos
- 1985 New England Patriots
- 1974 Minnesota Vikings
- 1984 Miami Dolphins
- 1988 Cincinnati Bengals
- 1994 San Diego Chargers
- 1992 Buffalo Bills
- 1966 Kansas City Chiefs
The Algorithm’s Top 36 Super Bowl teams all won the Super Bowl. Which leads to the fun part of the list: The best teams who didn’t win, and the bad teams who did.
Best 5 Super Bowl Teams That Didn’t Win The Super Bowl
- 2001 St Louis Rams
- 2014 Seattle Seahawks
- 2008 Arizona Cardinals
- 1998 Green Bay Packers
- 2017 New England Patriots
Worst 5 Super Bowl Teams That Won The Super Bowl
- 2015 Denver Broncos
- 2021 LA Rams
- 2014 New England Patriots
- 2001 New England Patriots
- 2012 Baltimore Ravens
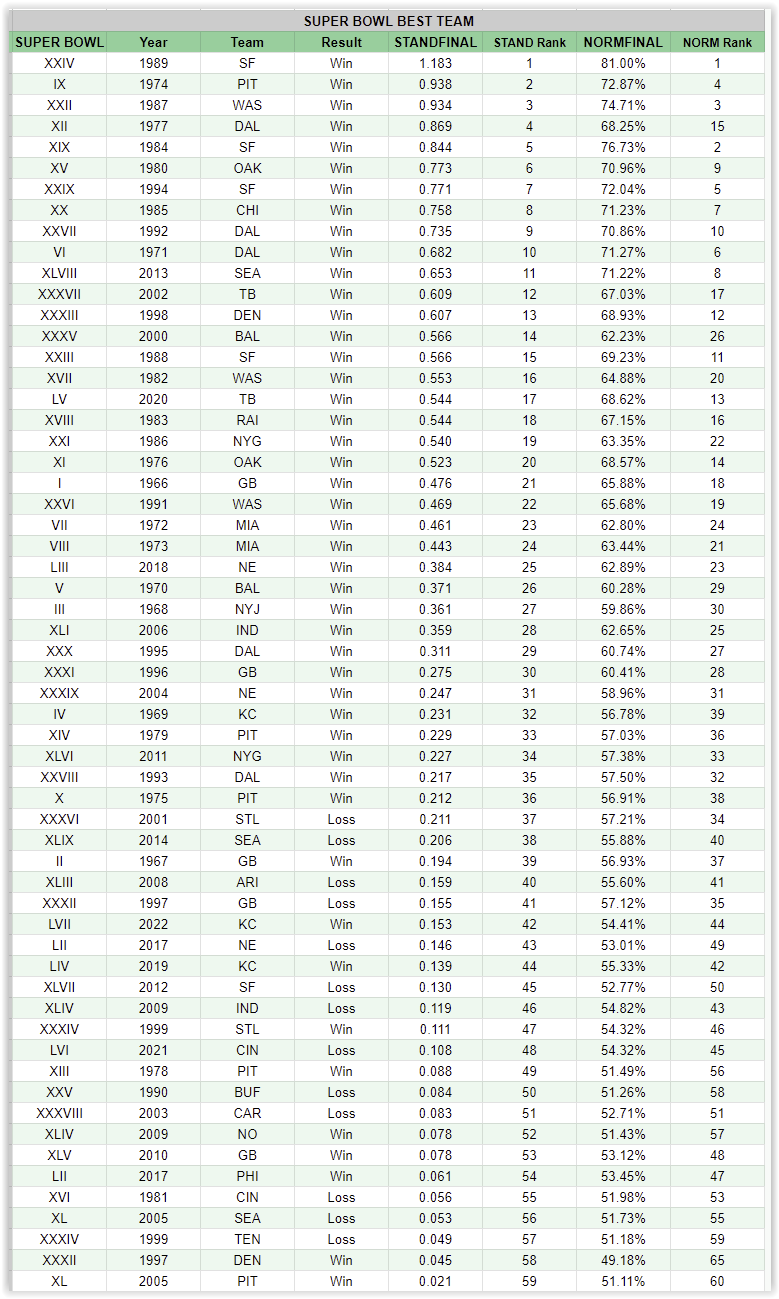
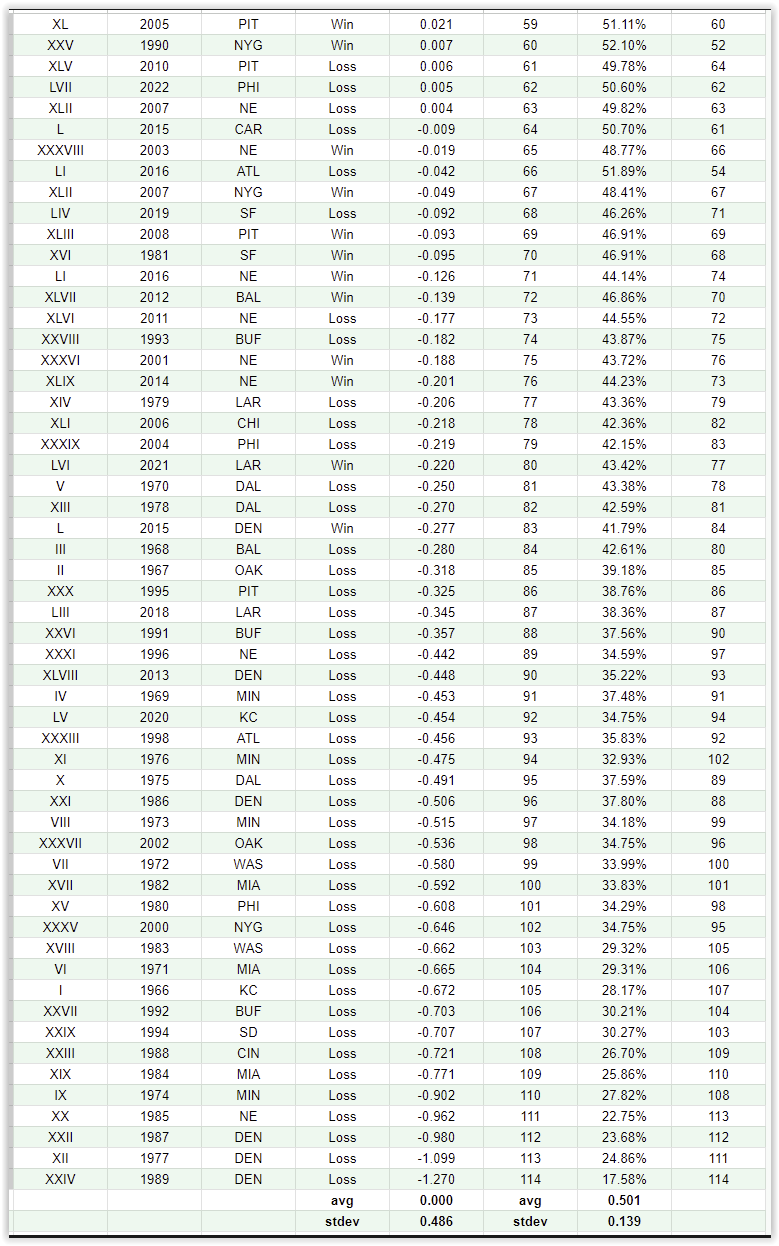
Using Standard Deviation To Measure The Performance
To see how the performances rank we can use standard deviation and normalization on the final ratings list. This will show how great or how poor each performance was relative to each other.
Standard Deviation Scale
Here is a simple breakdown for standard deviation units(SDU)
Outstanding = 2.00+
Good To Great = 1.01+ thru 2.00
Average to Good = 0.00 thru 1.00
Average to Poor = 0.00 thru -1.00
Poor to Very Poor = -1.01 thru -2.00
Abysmal = -2.01 & Below
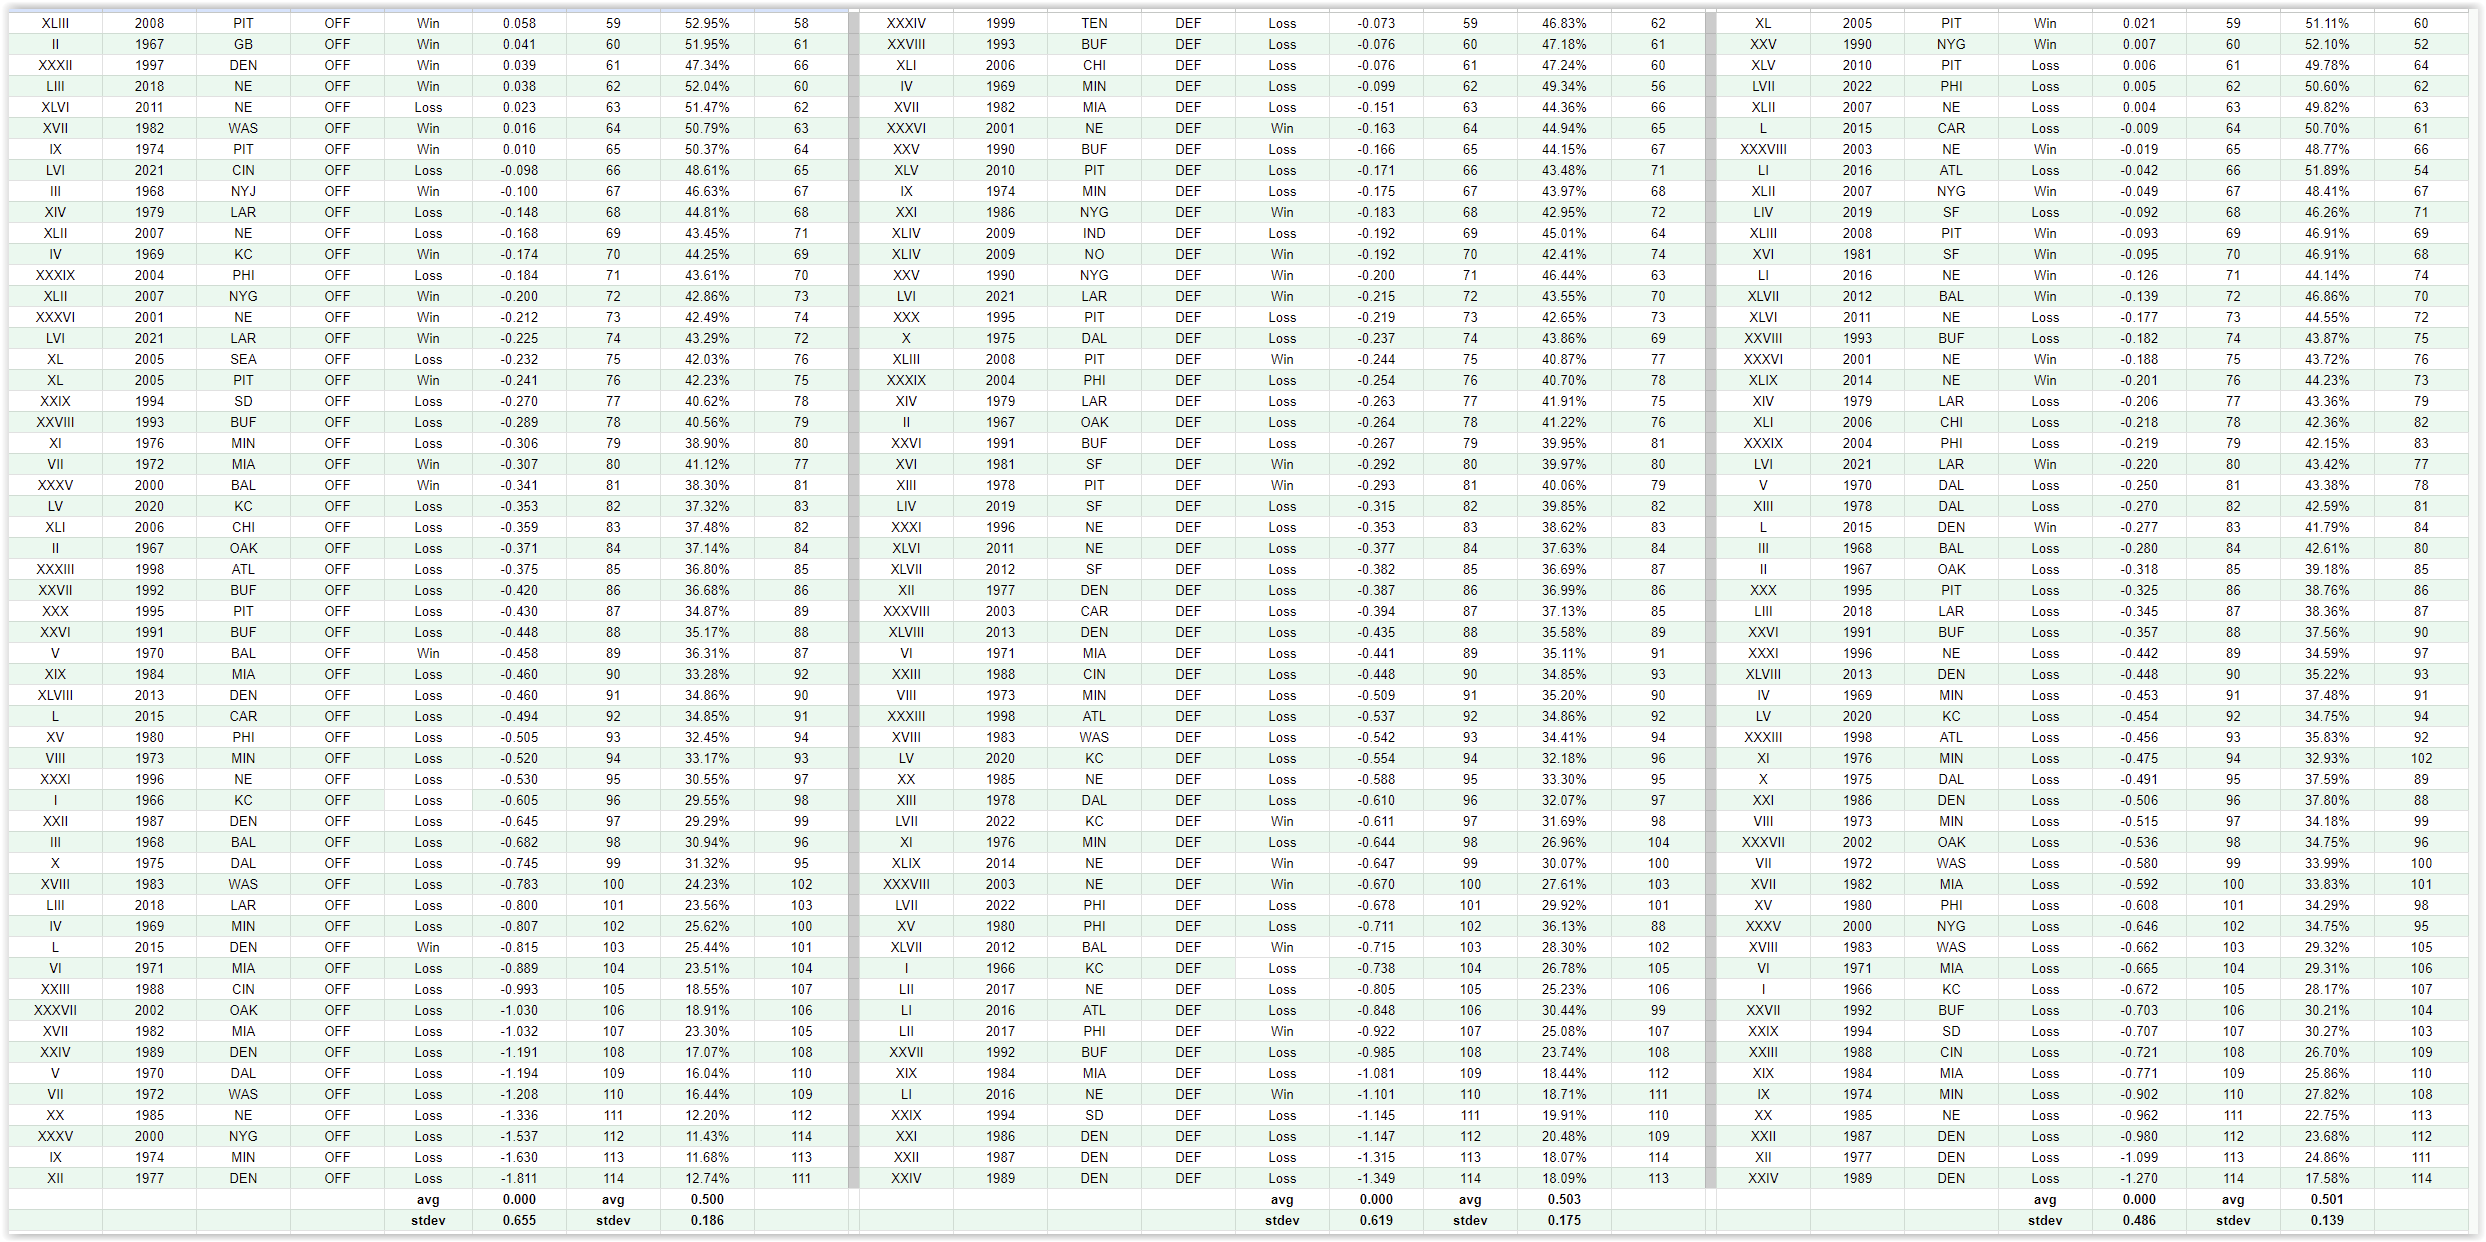
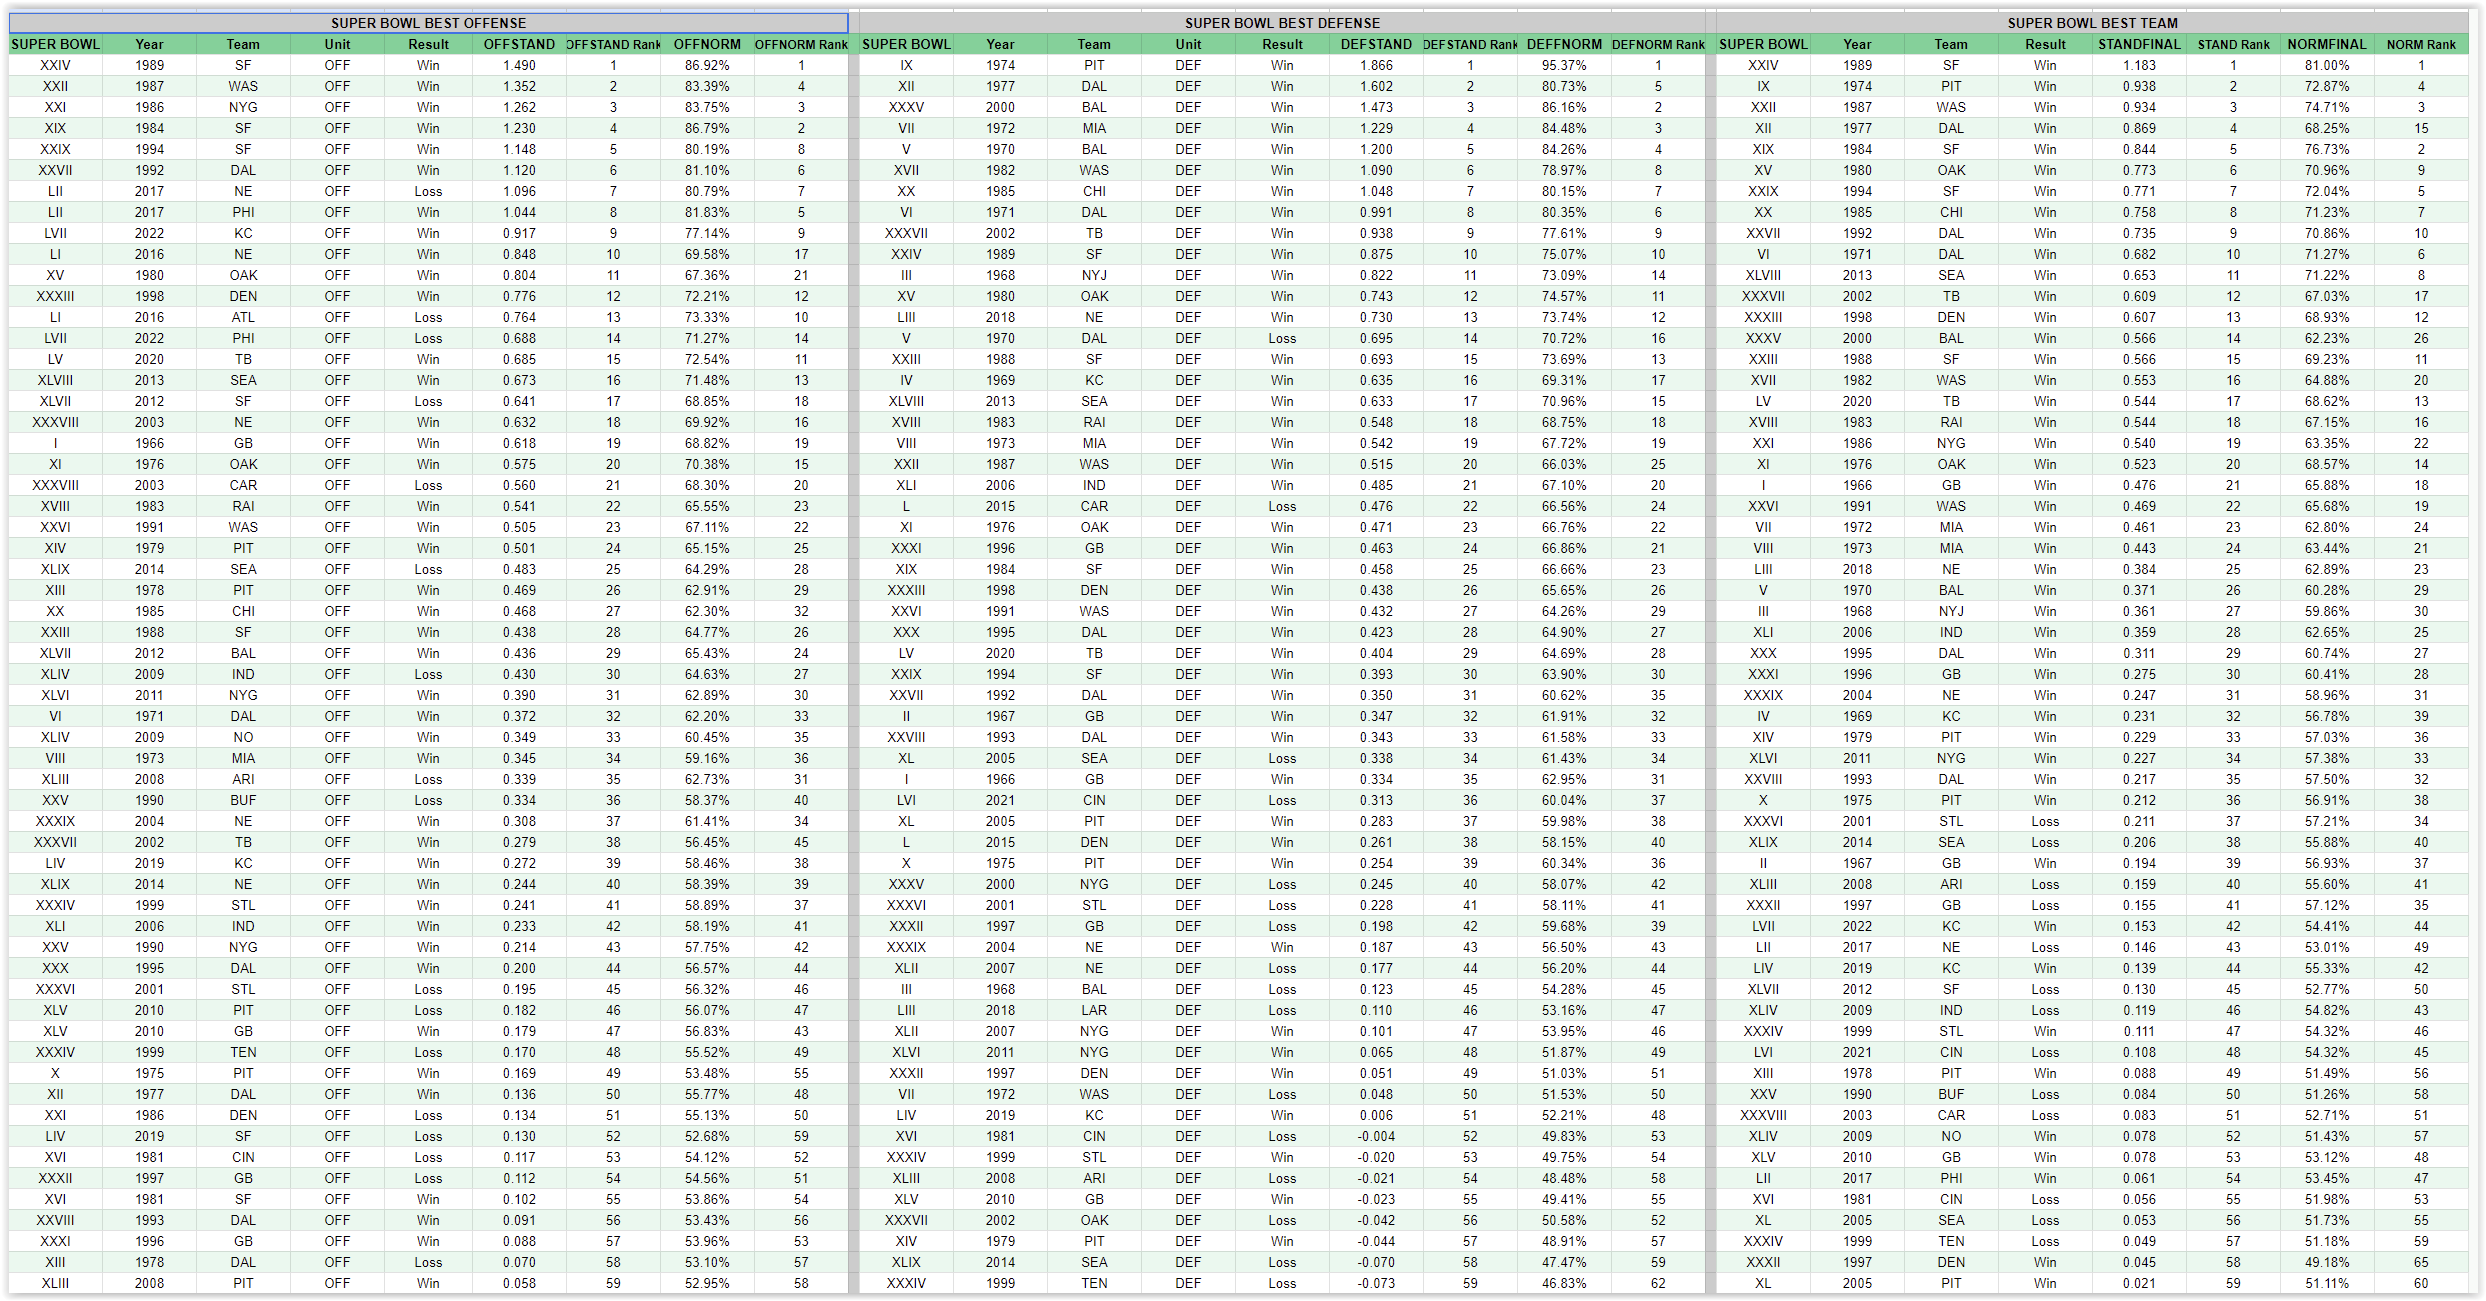
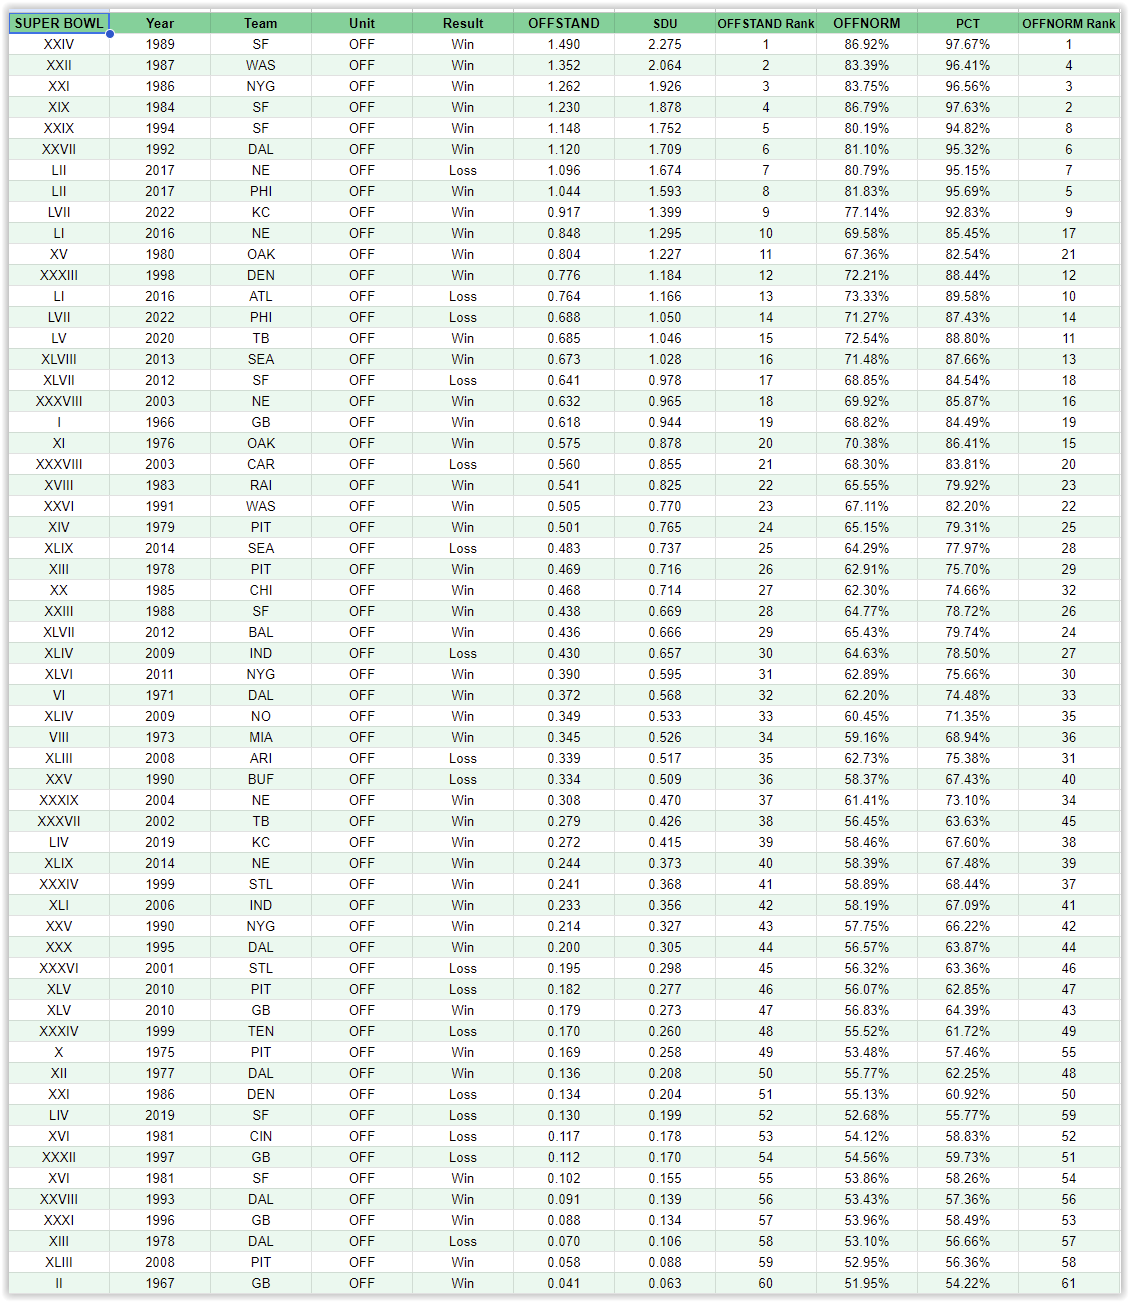
114 Super Bowl Offenses – Best To Worst
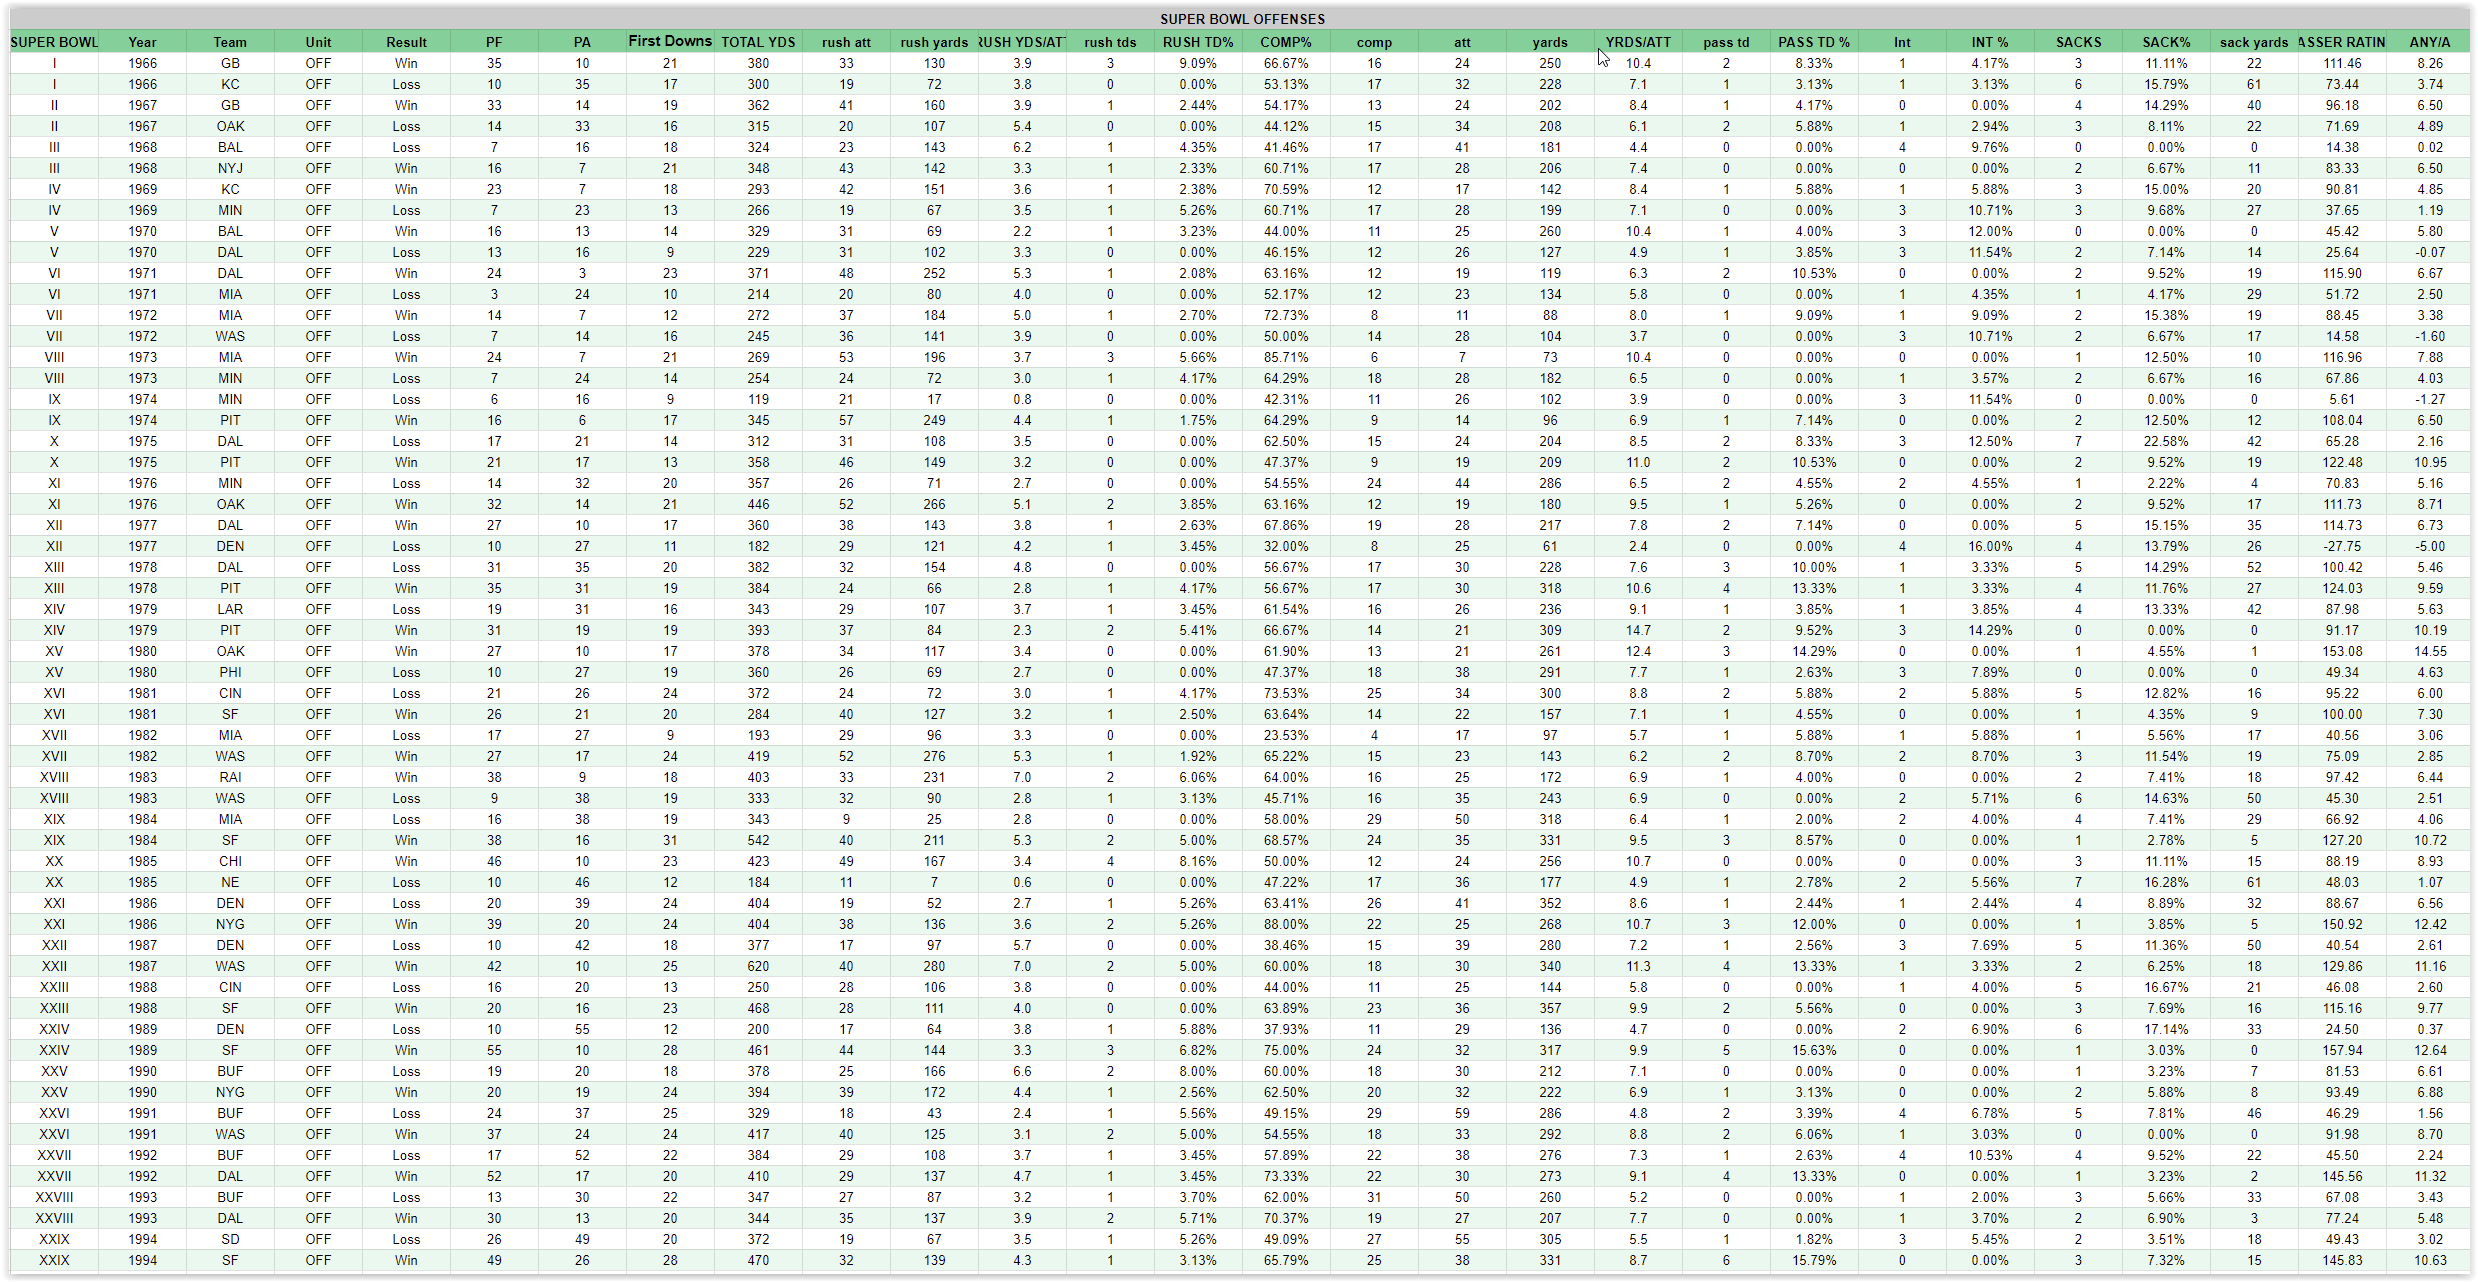
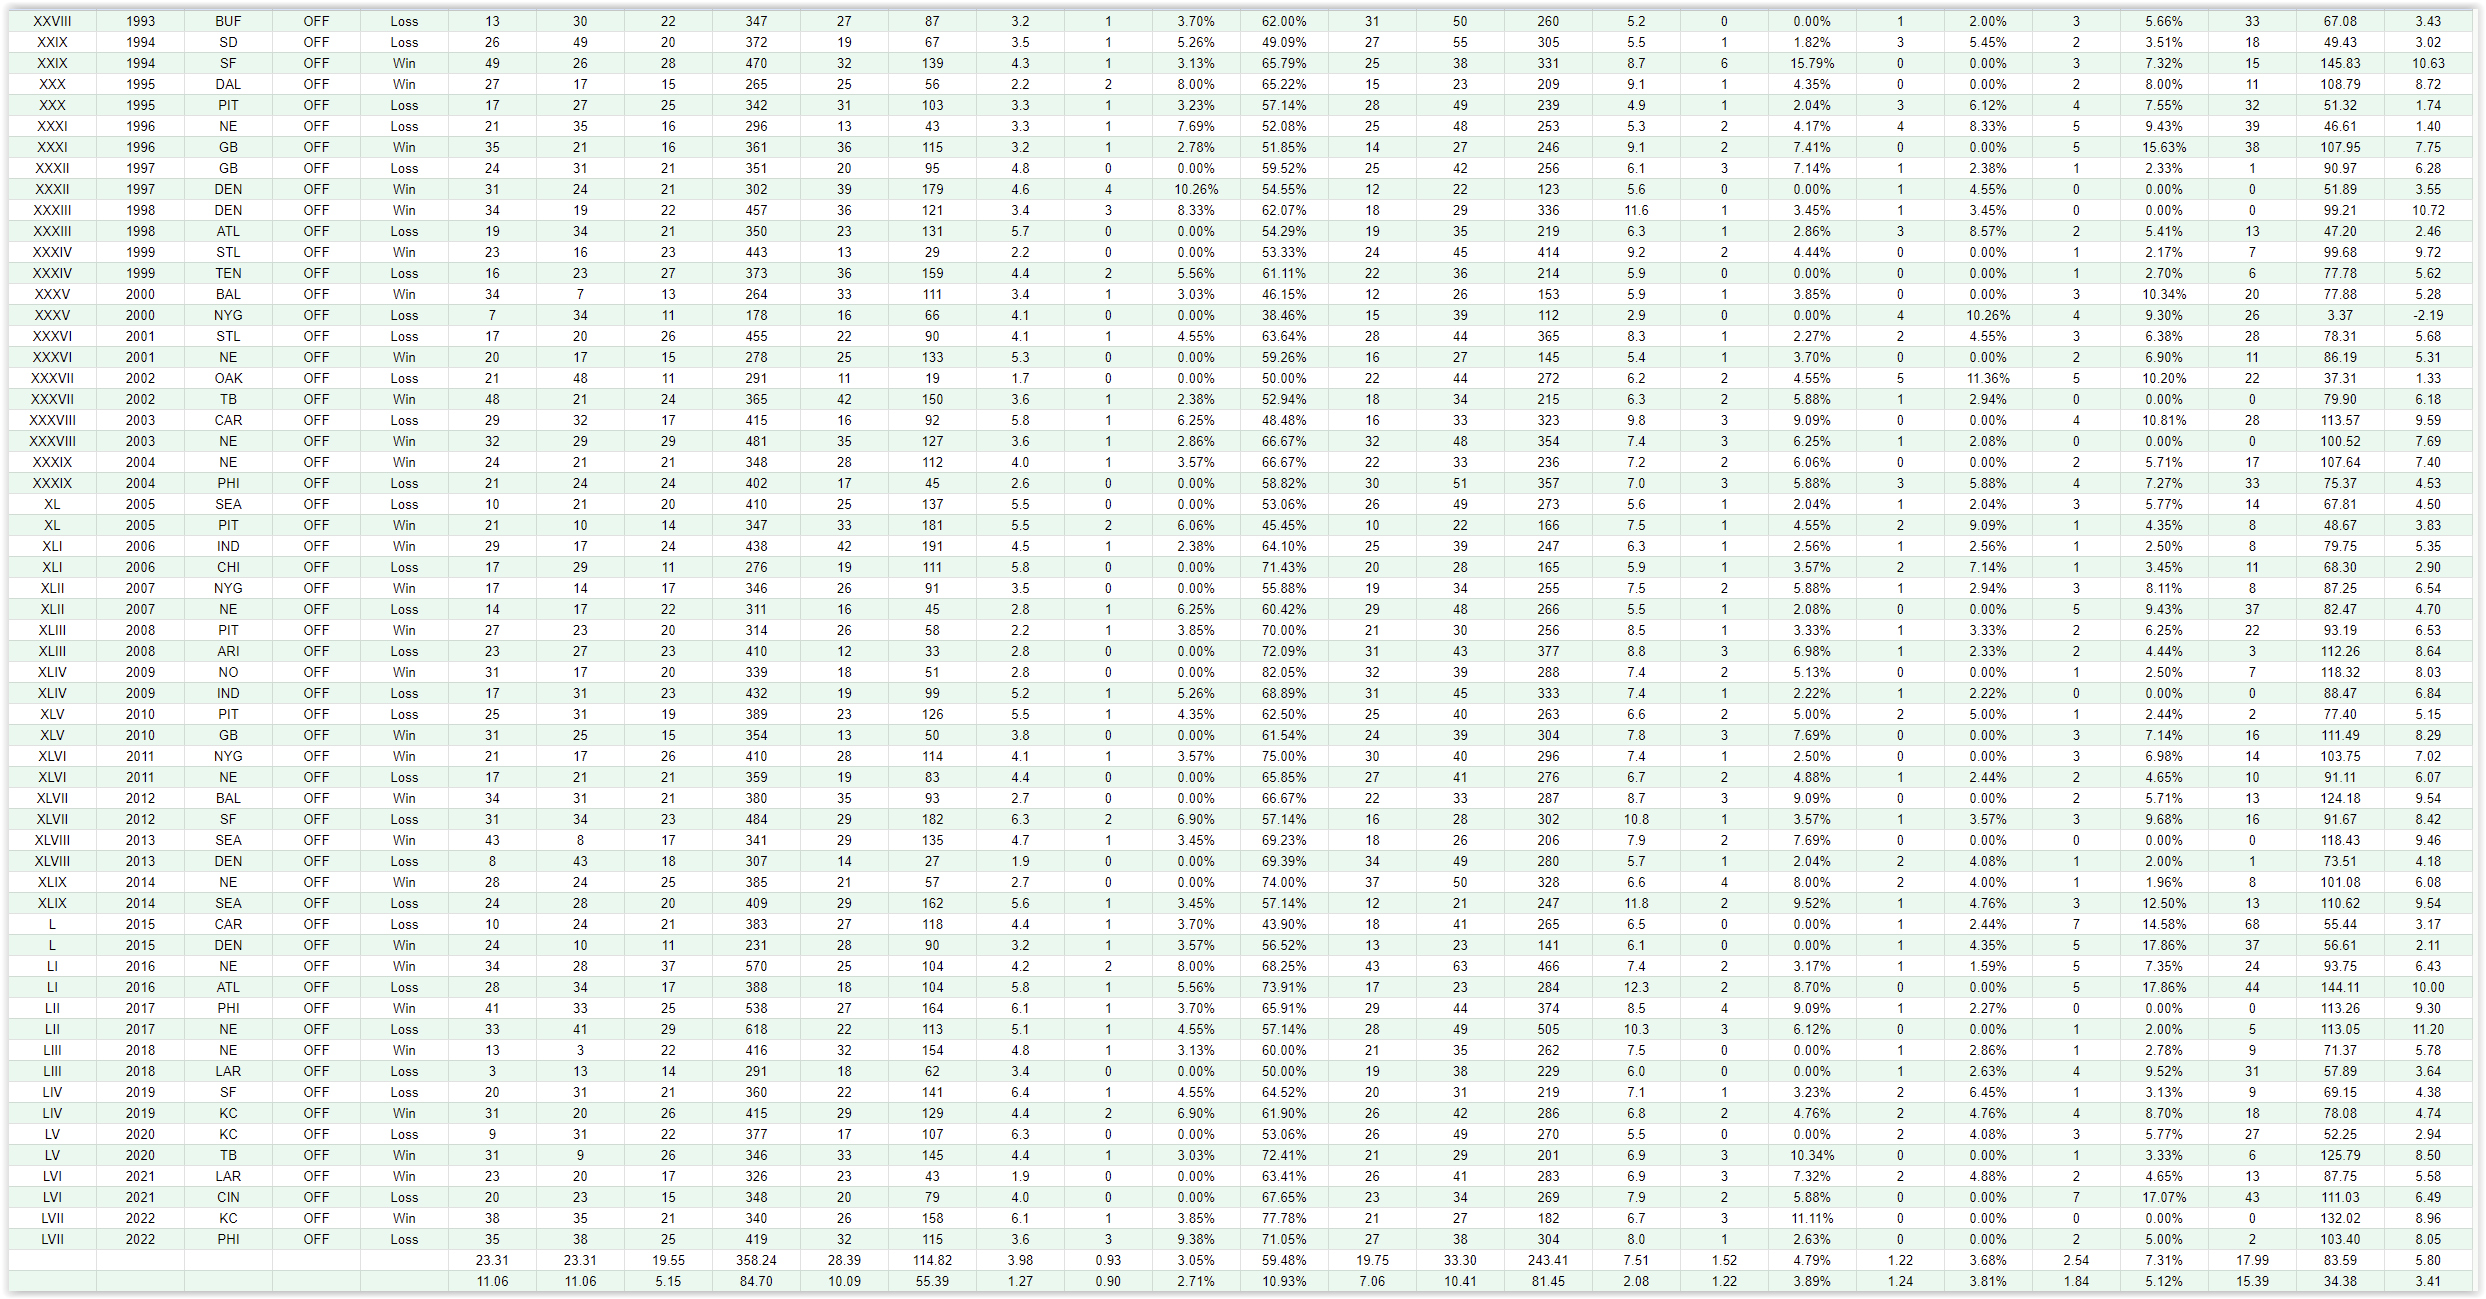
Above you can see the statisstics for each of the 114 team offenses put up in the 57 Super Bowls played so far. Using the box score stats, we can generate passer rating, ANY/As and things like Rush yards/ attempt, completion % and more.
Using the 12 stats listed above, we then average out the metric, get the standard deviation, and then we can score each teams’ performance against the avg/SD and each other.
Here is the offensive scoring chart. This shows the score for each statistic the team received. Essentially the defensive chart is a mirror of this chart so I will spare you the upload.
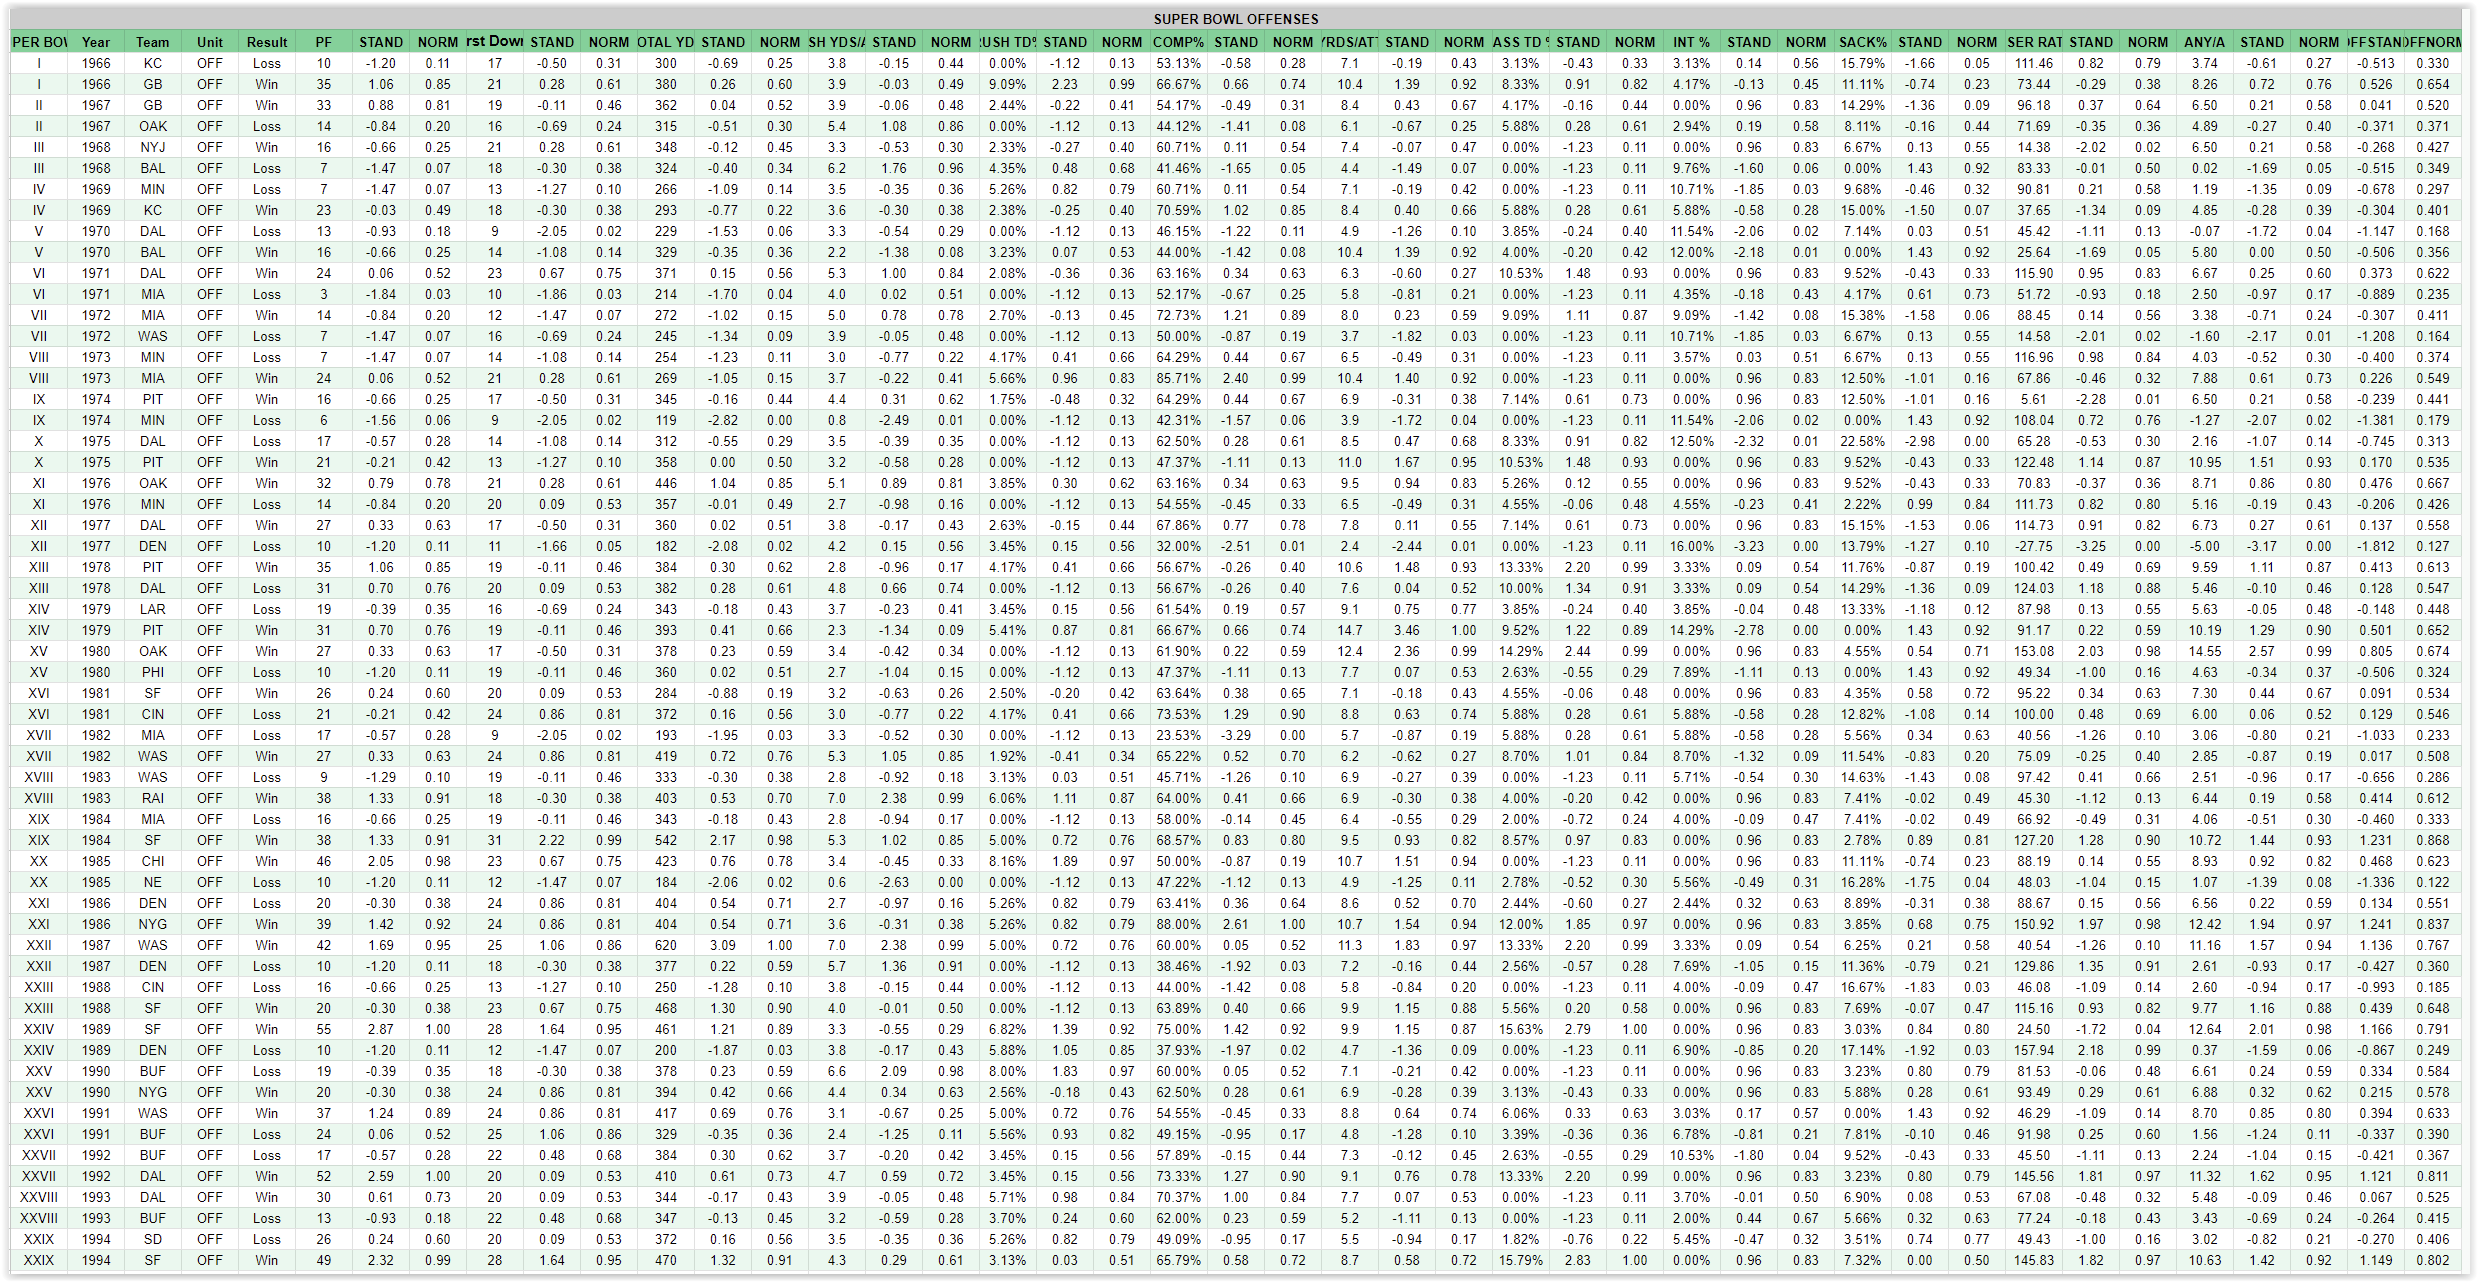
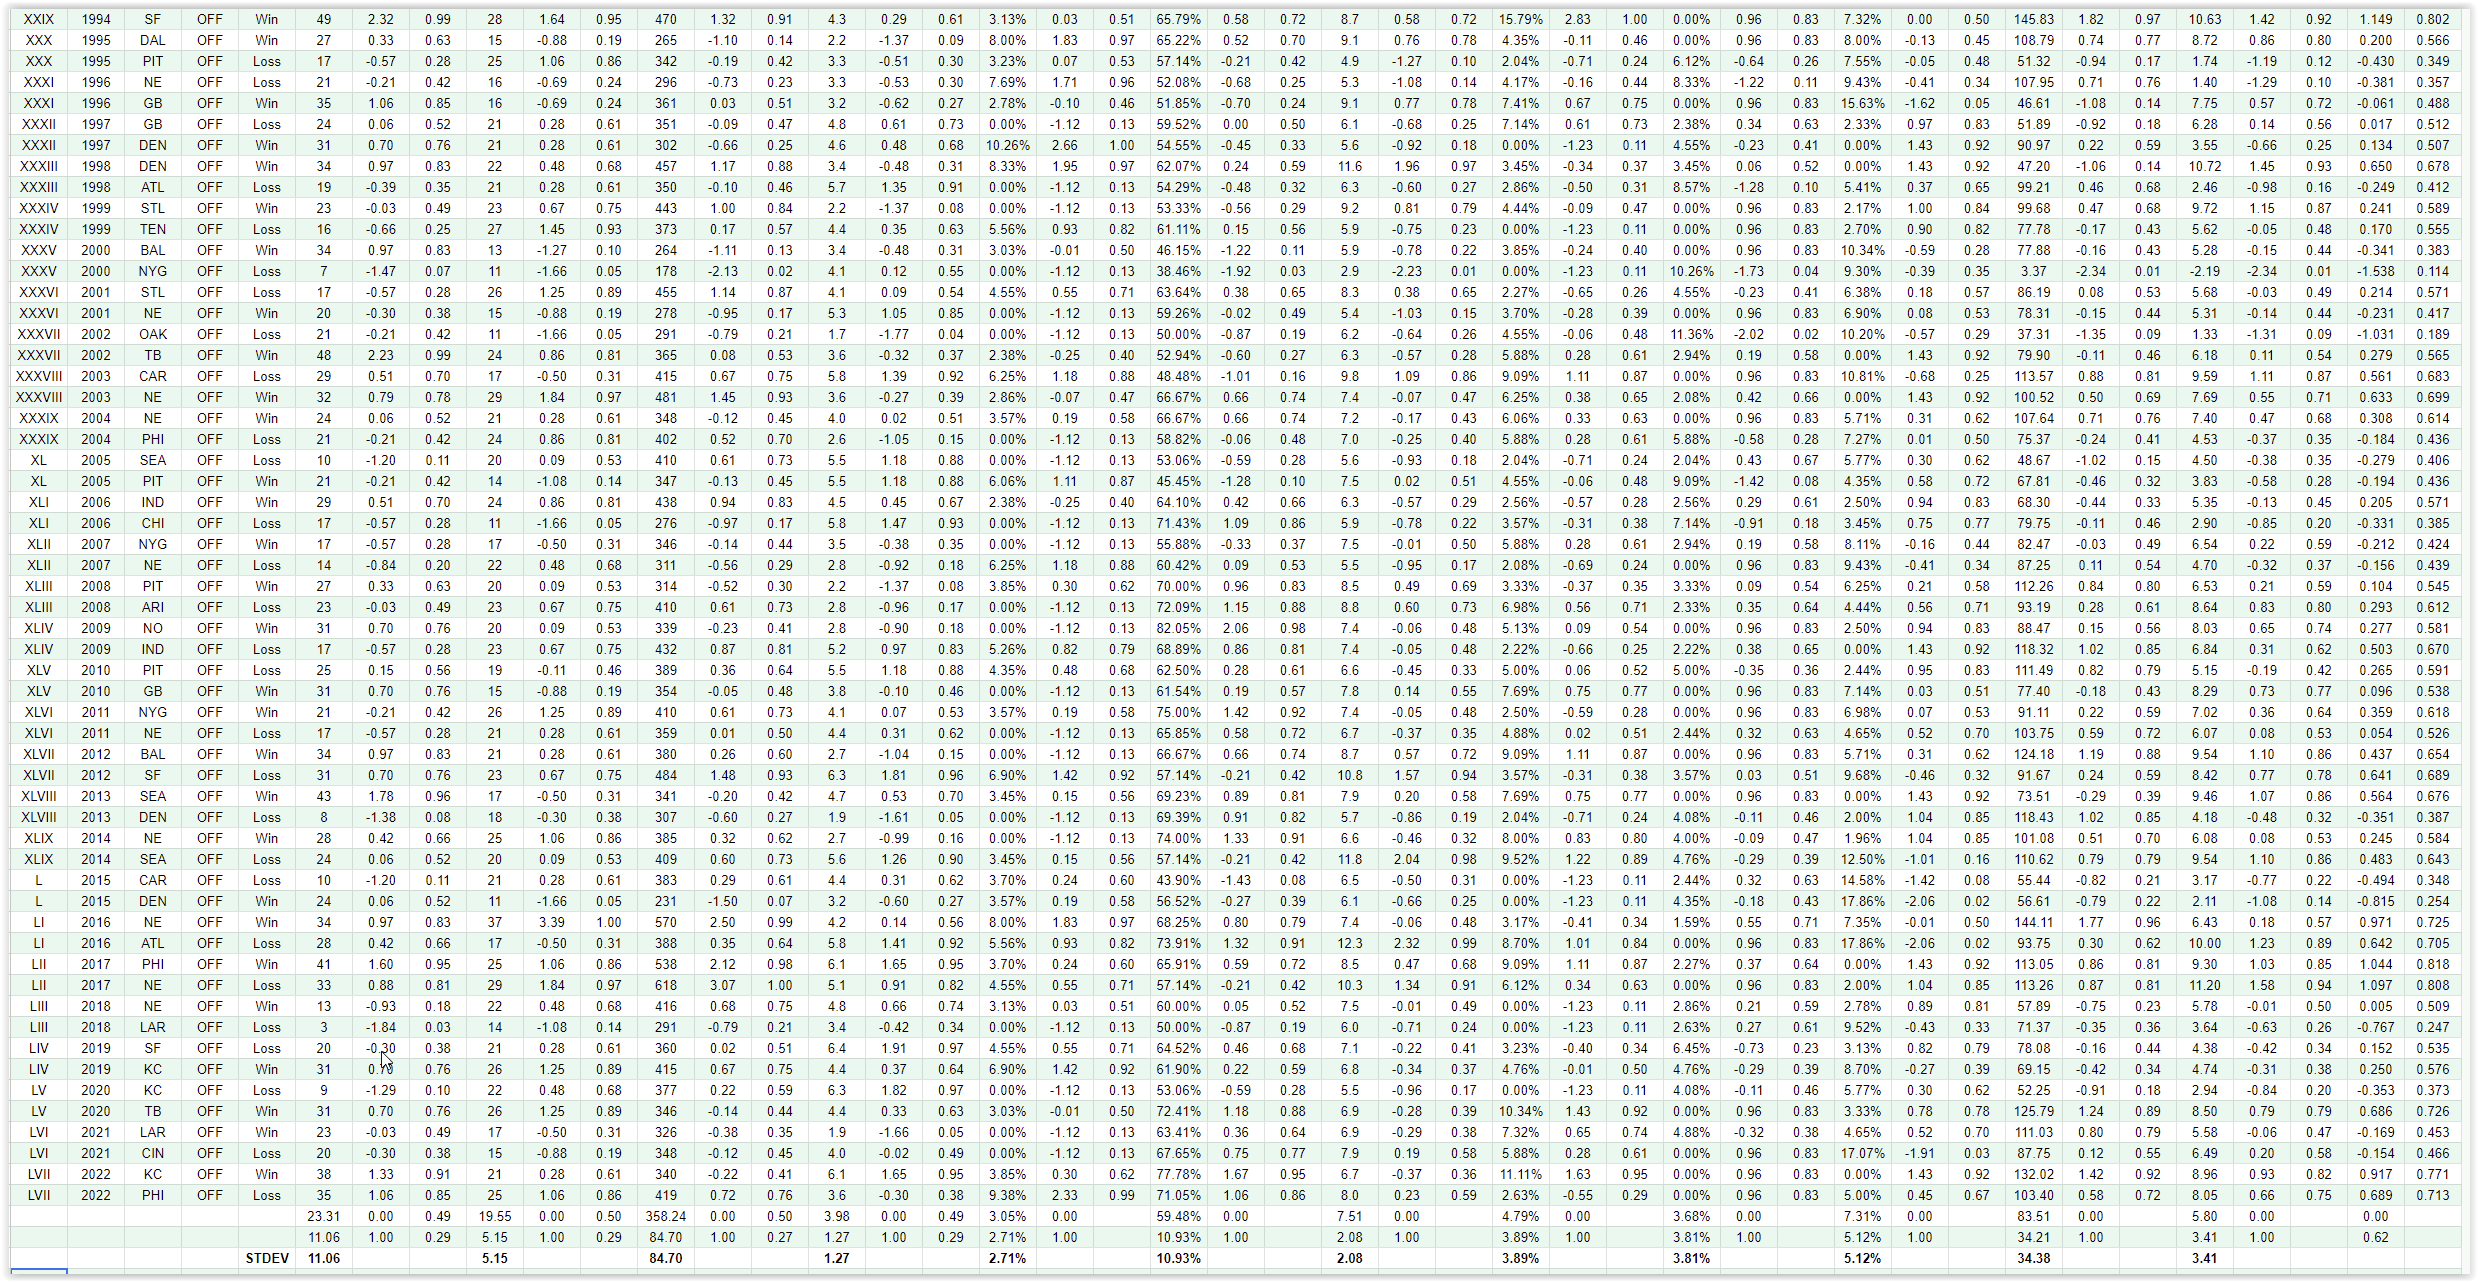
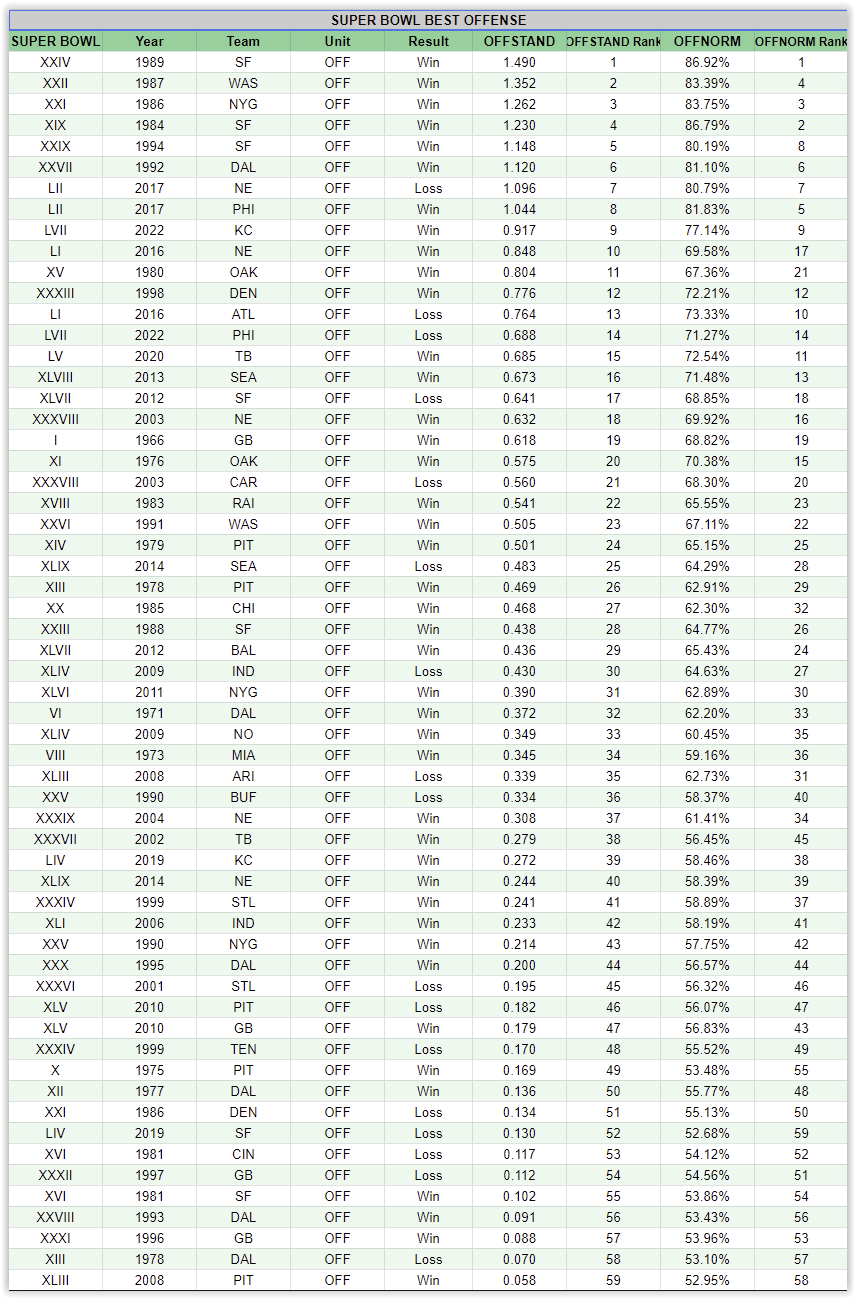
Once we sum up the scores and average them out, we are left with a final Offensive Standardization & Offensive Normalization score for each teams’ offense. For sorting purposes I used Standardization ranking but you can see the normalization score and ranking right next to it.
Top 10 – Best Super Bowl Team Offenses
- 1989 San Francisco 49ers
- 1987 Washington Redskins
- 1986 NY Giants
- 1984 San Francisco 49ers
- 1994 San Francisco 49ers
- 1992 Dallas Cowboys
- 2017 New England Patriots (Loss)
- 2017 Philadelphia Eagles
- 2022 Kansas City Chiefs
- 2016 New England Patriots
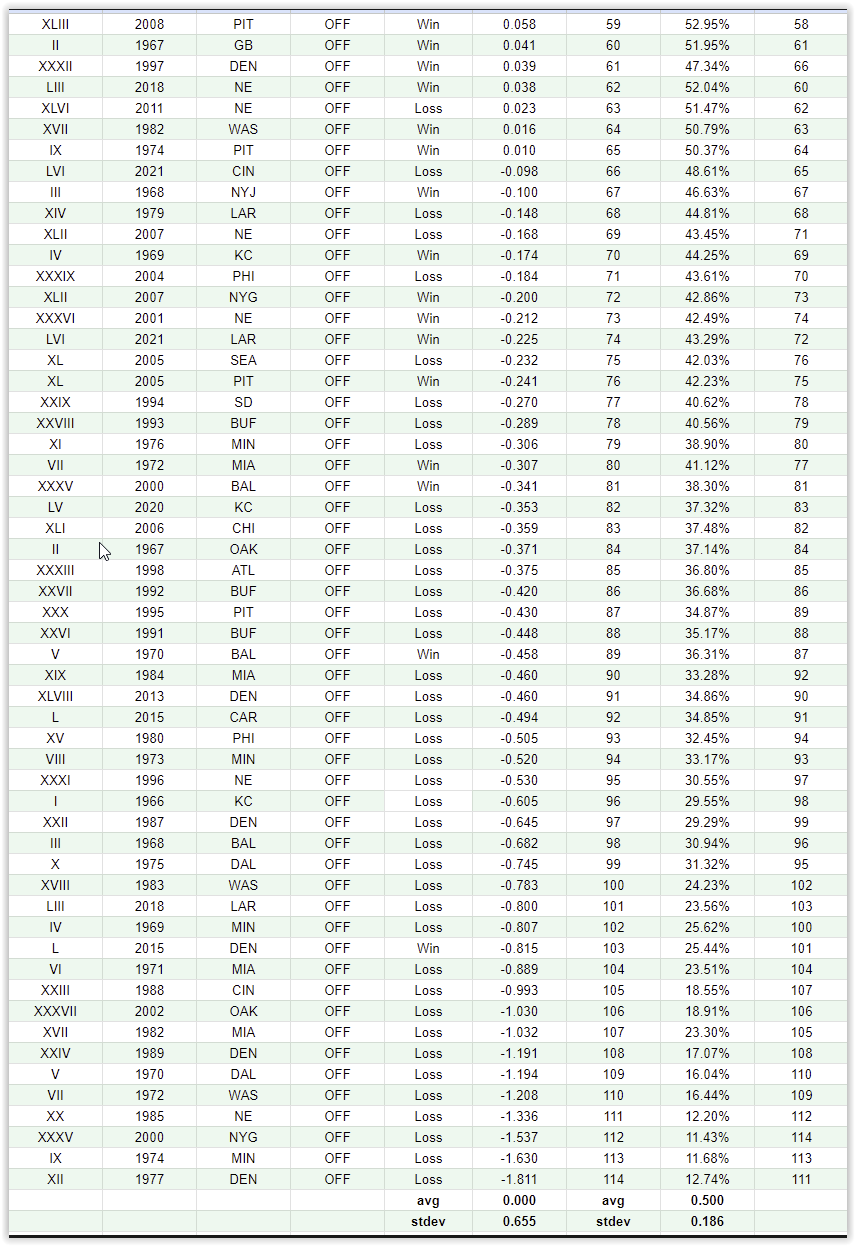
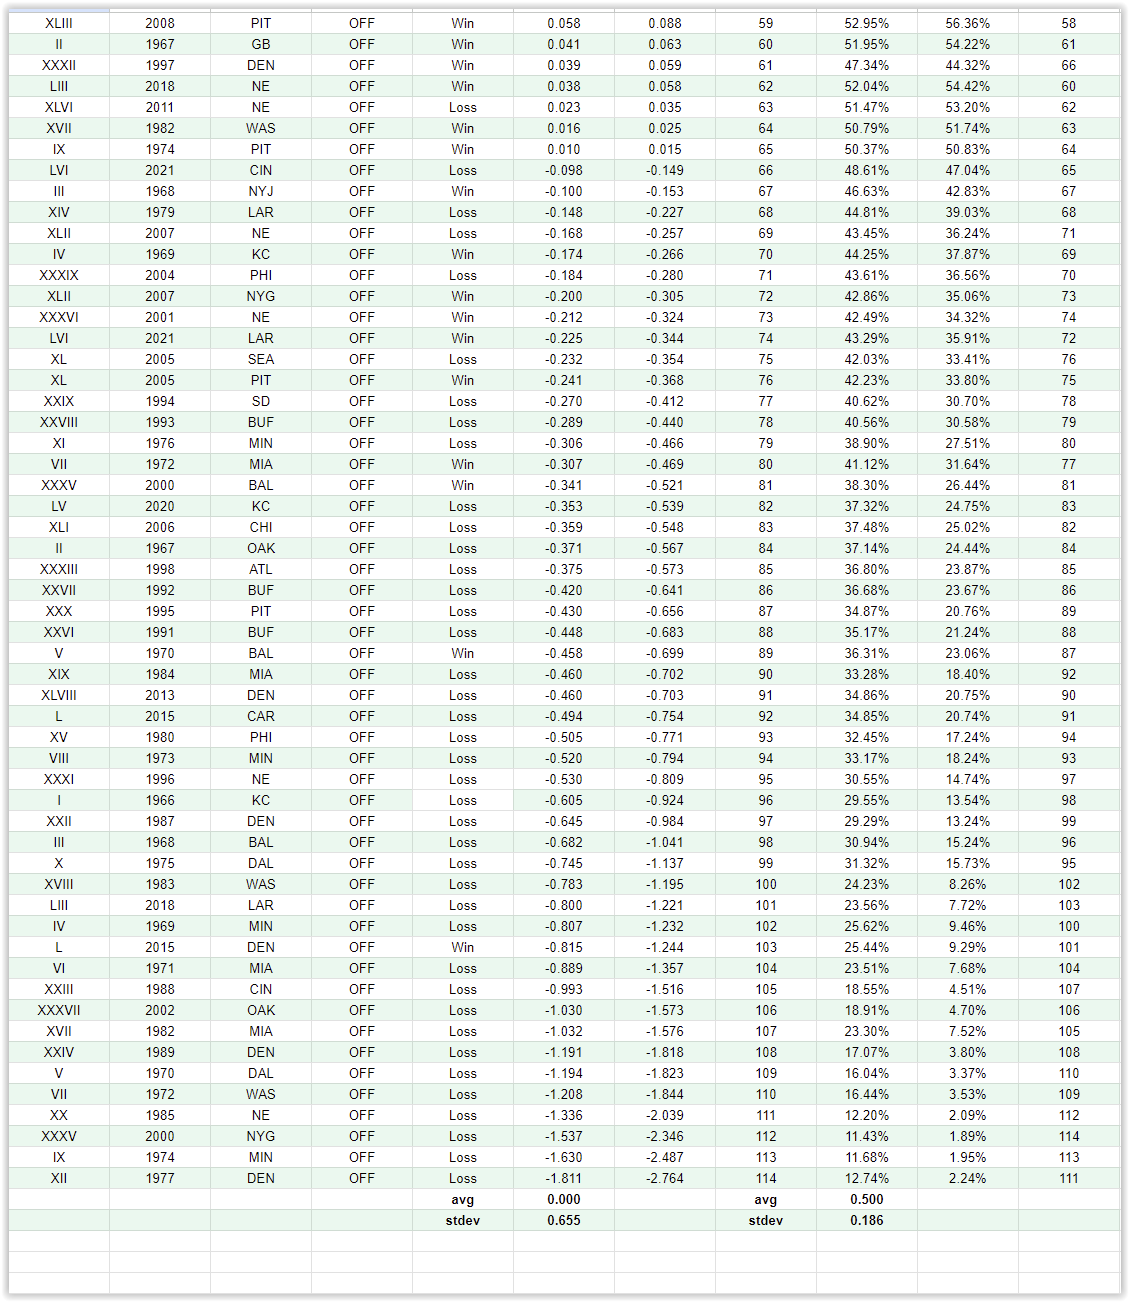
Bottom 10 – Worst Super Bowl Team Offenses
- 1977 Denver Broncos
- 1974 Minnesota Vikings
- 2000 NY Giants
- 1985 New England Patriots
- 1972 Washington redskins
- 1970 Dallas Cowboys
- 1989 Denver Borncos
- 1982 Miami Dolphins
- 202 Oakland Raiders
- 1988 Cincinnati Bengals
Standard Deviation Scale
Here is a simple breakdown for standard deviation units(SDU)
Outstanding = 2.00+
Good To Great = 1.01+ thru 2.00
Average to Good = 0.00 thru 1.00
Average to Poor = 0.00 thru -1.00
Poor to Very Poor = -1.01 thru -2.00
Abysmal = -2.01 & Below
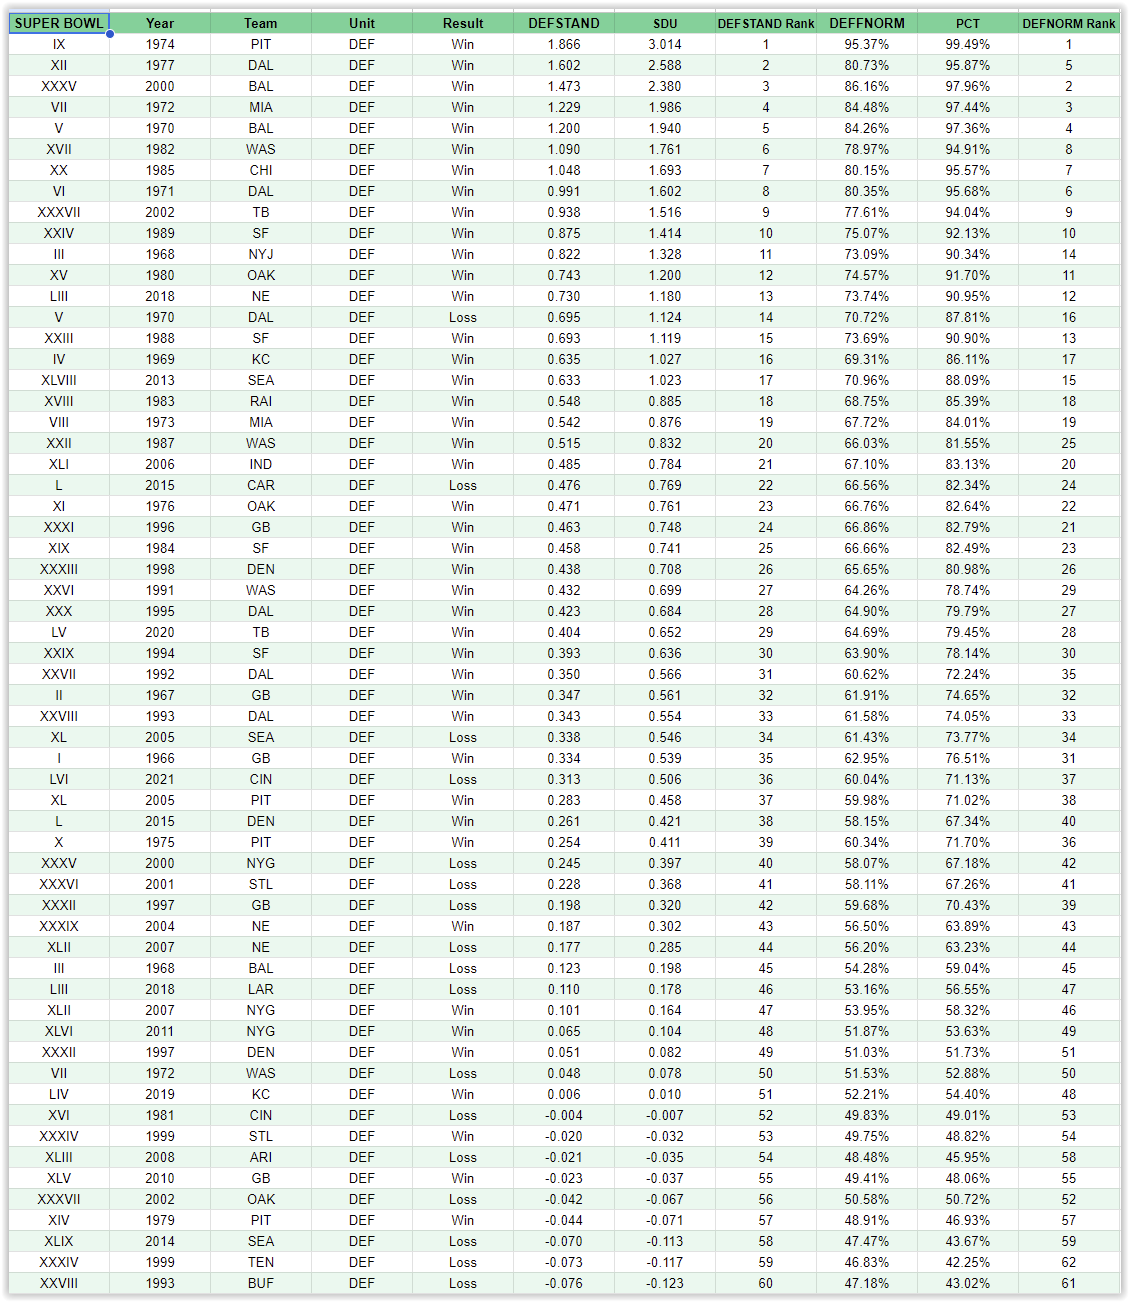
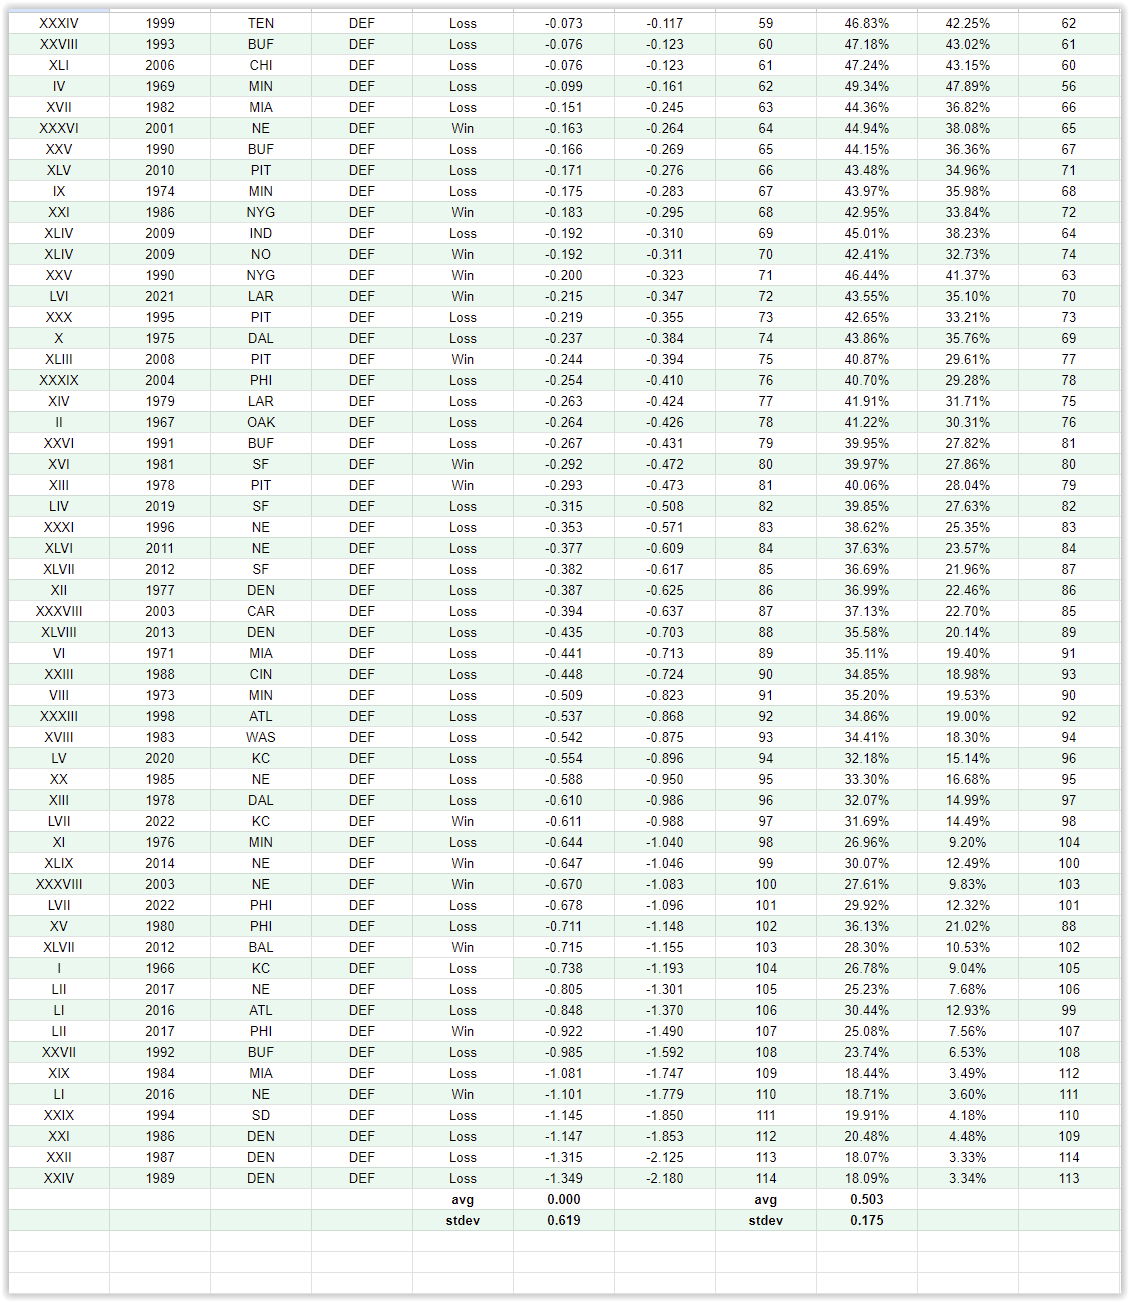
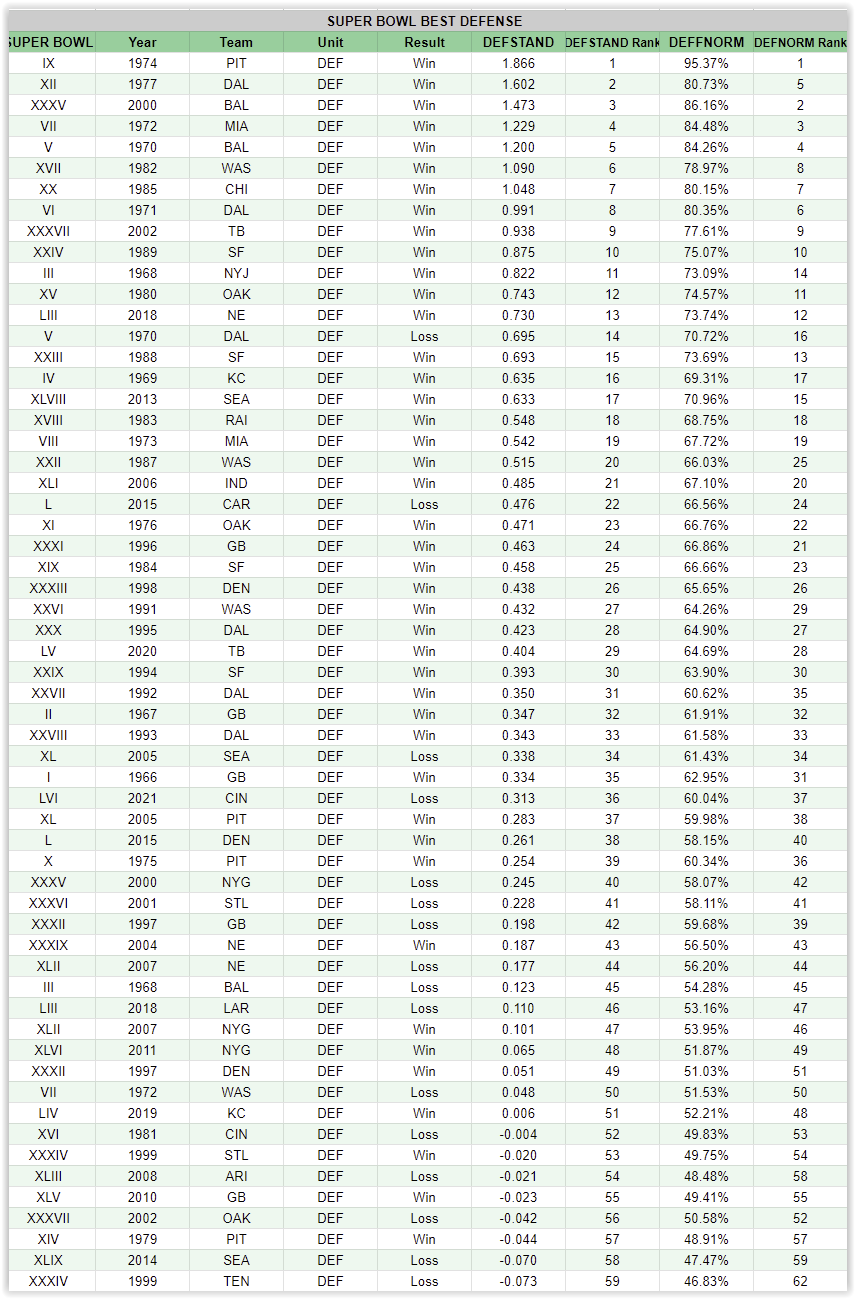
114 Super Bowl Defenses – Best To Worst
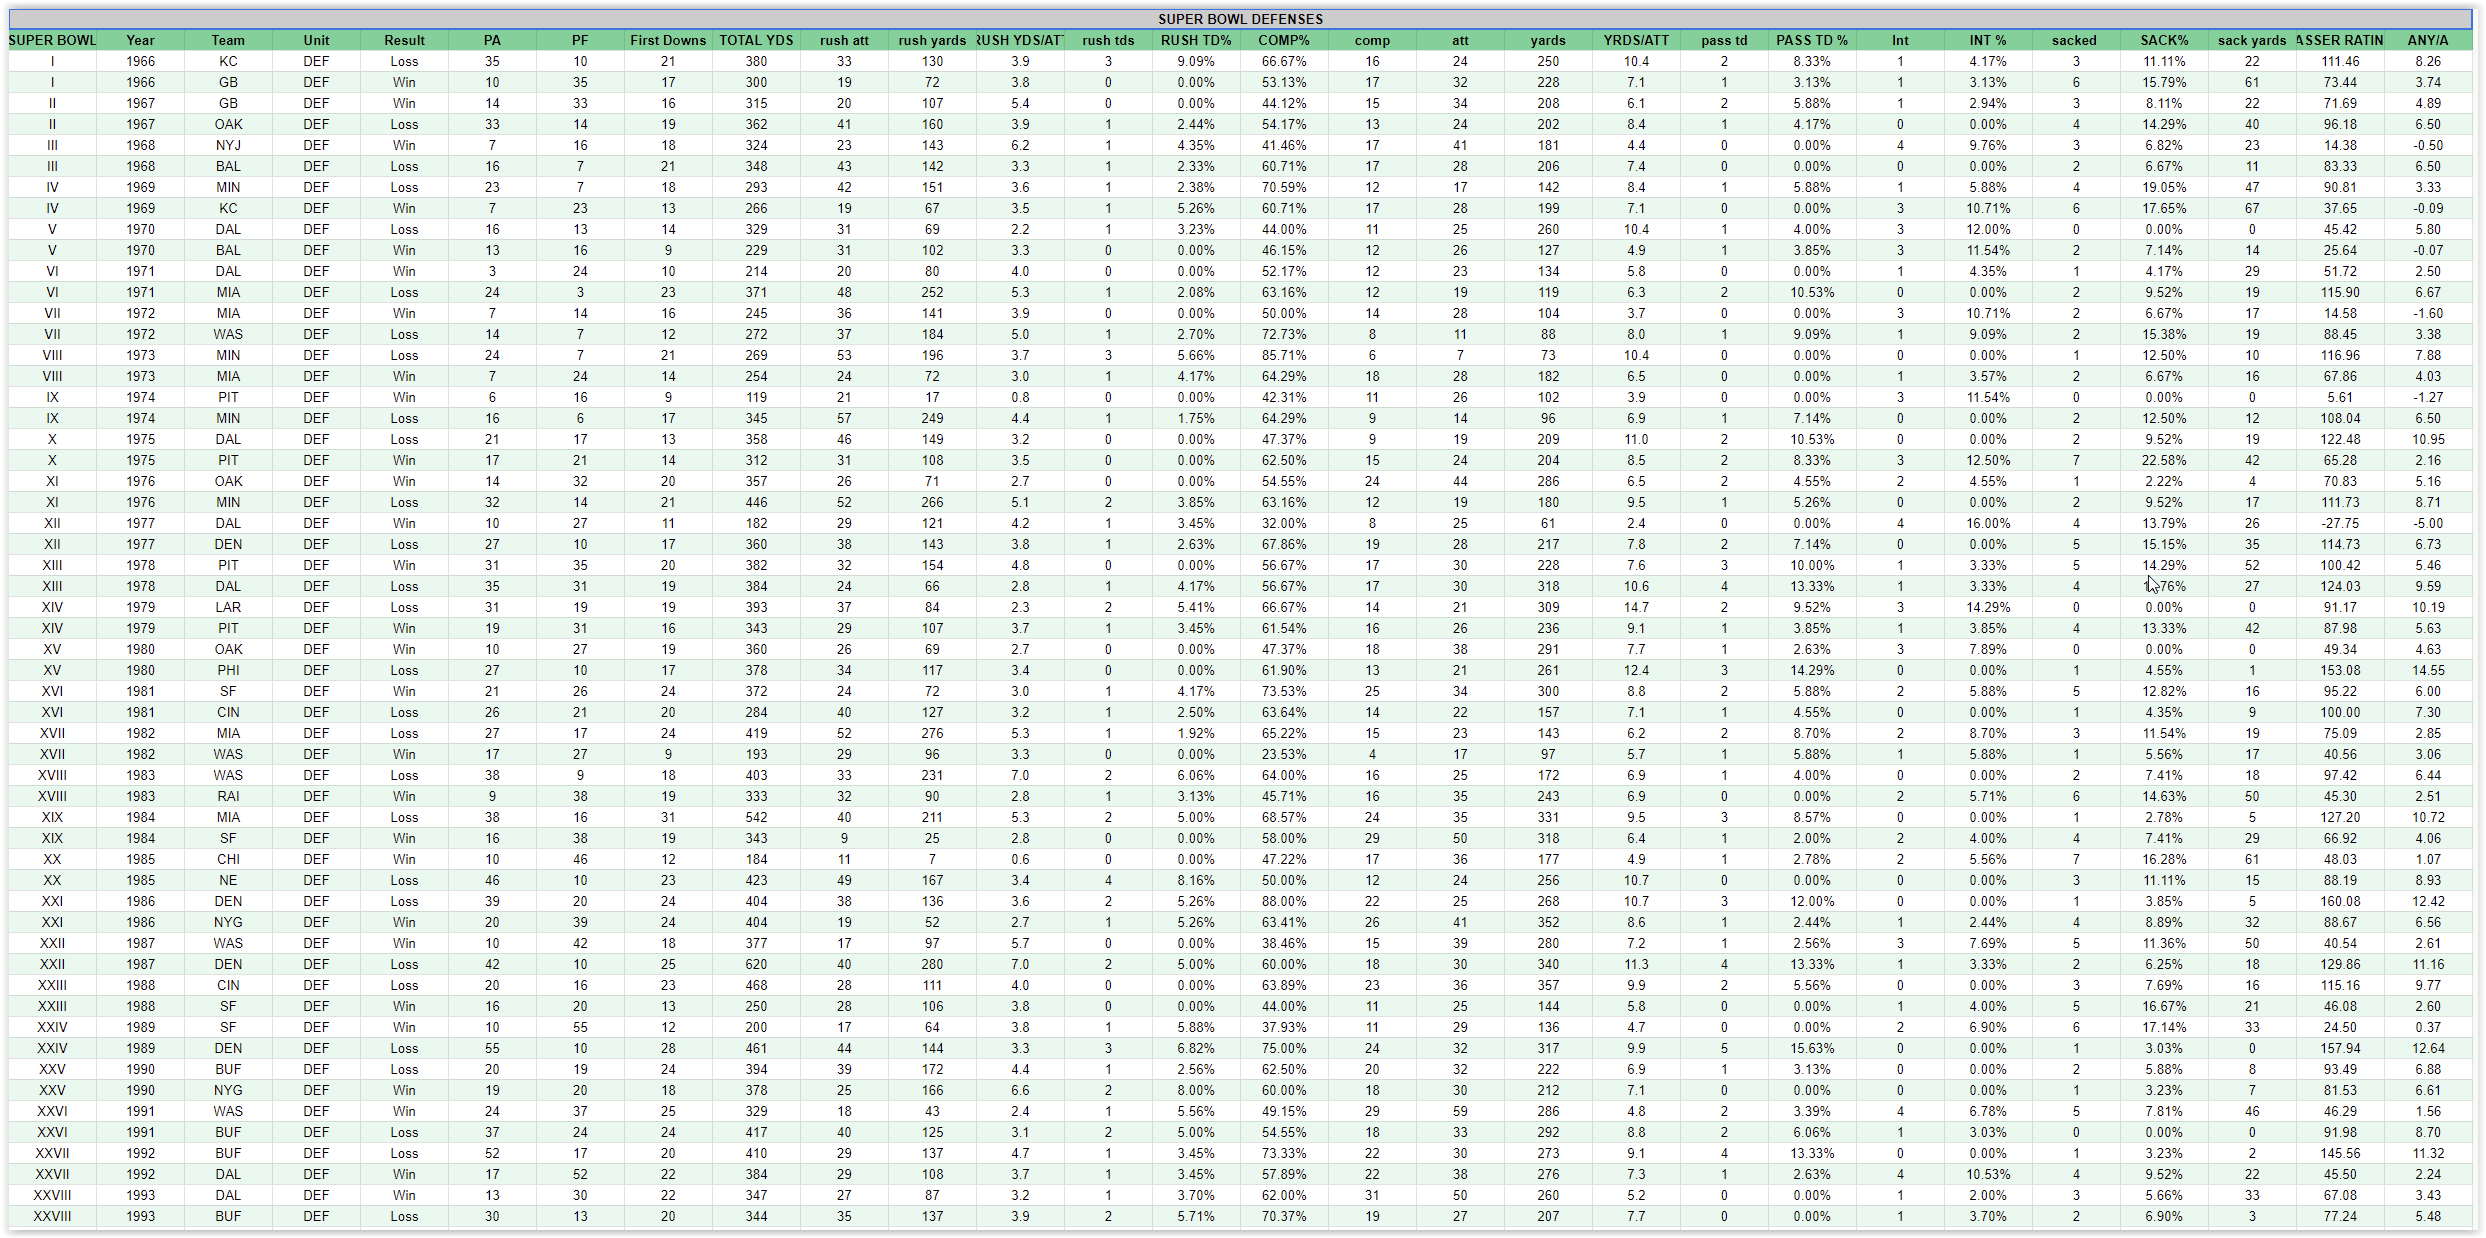
Using the defensives stats from the 57 Super Bowls, we can create the same ratings and rankings as we did for the offenses.
Top 10 – Best Super Bowl Team Defenses
- 1974 Pittsburgh Steelers
- 1977 Dallas Cowboys
- 2000 Baltimore Ravens
- 1972 Miami Dolphins
- 1970 Baltimore Ravens
- 1982 Washington Redskins
- 1985 Chicago Bears
- 1971 Dallas Cowboys
- 2002 Tampa Bay Buccanneers
- 1989 San Francisco 49ers
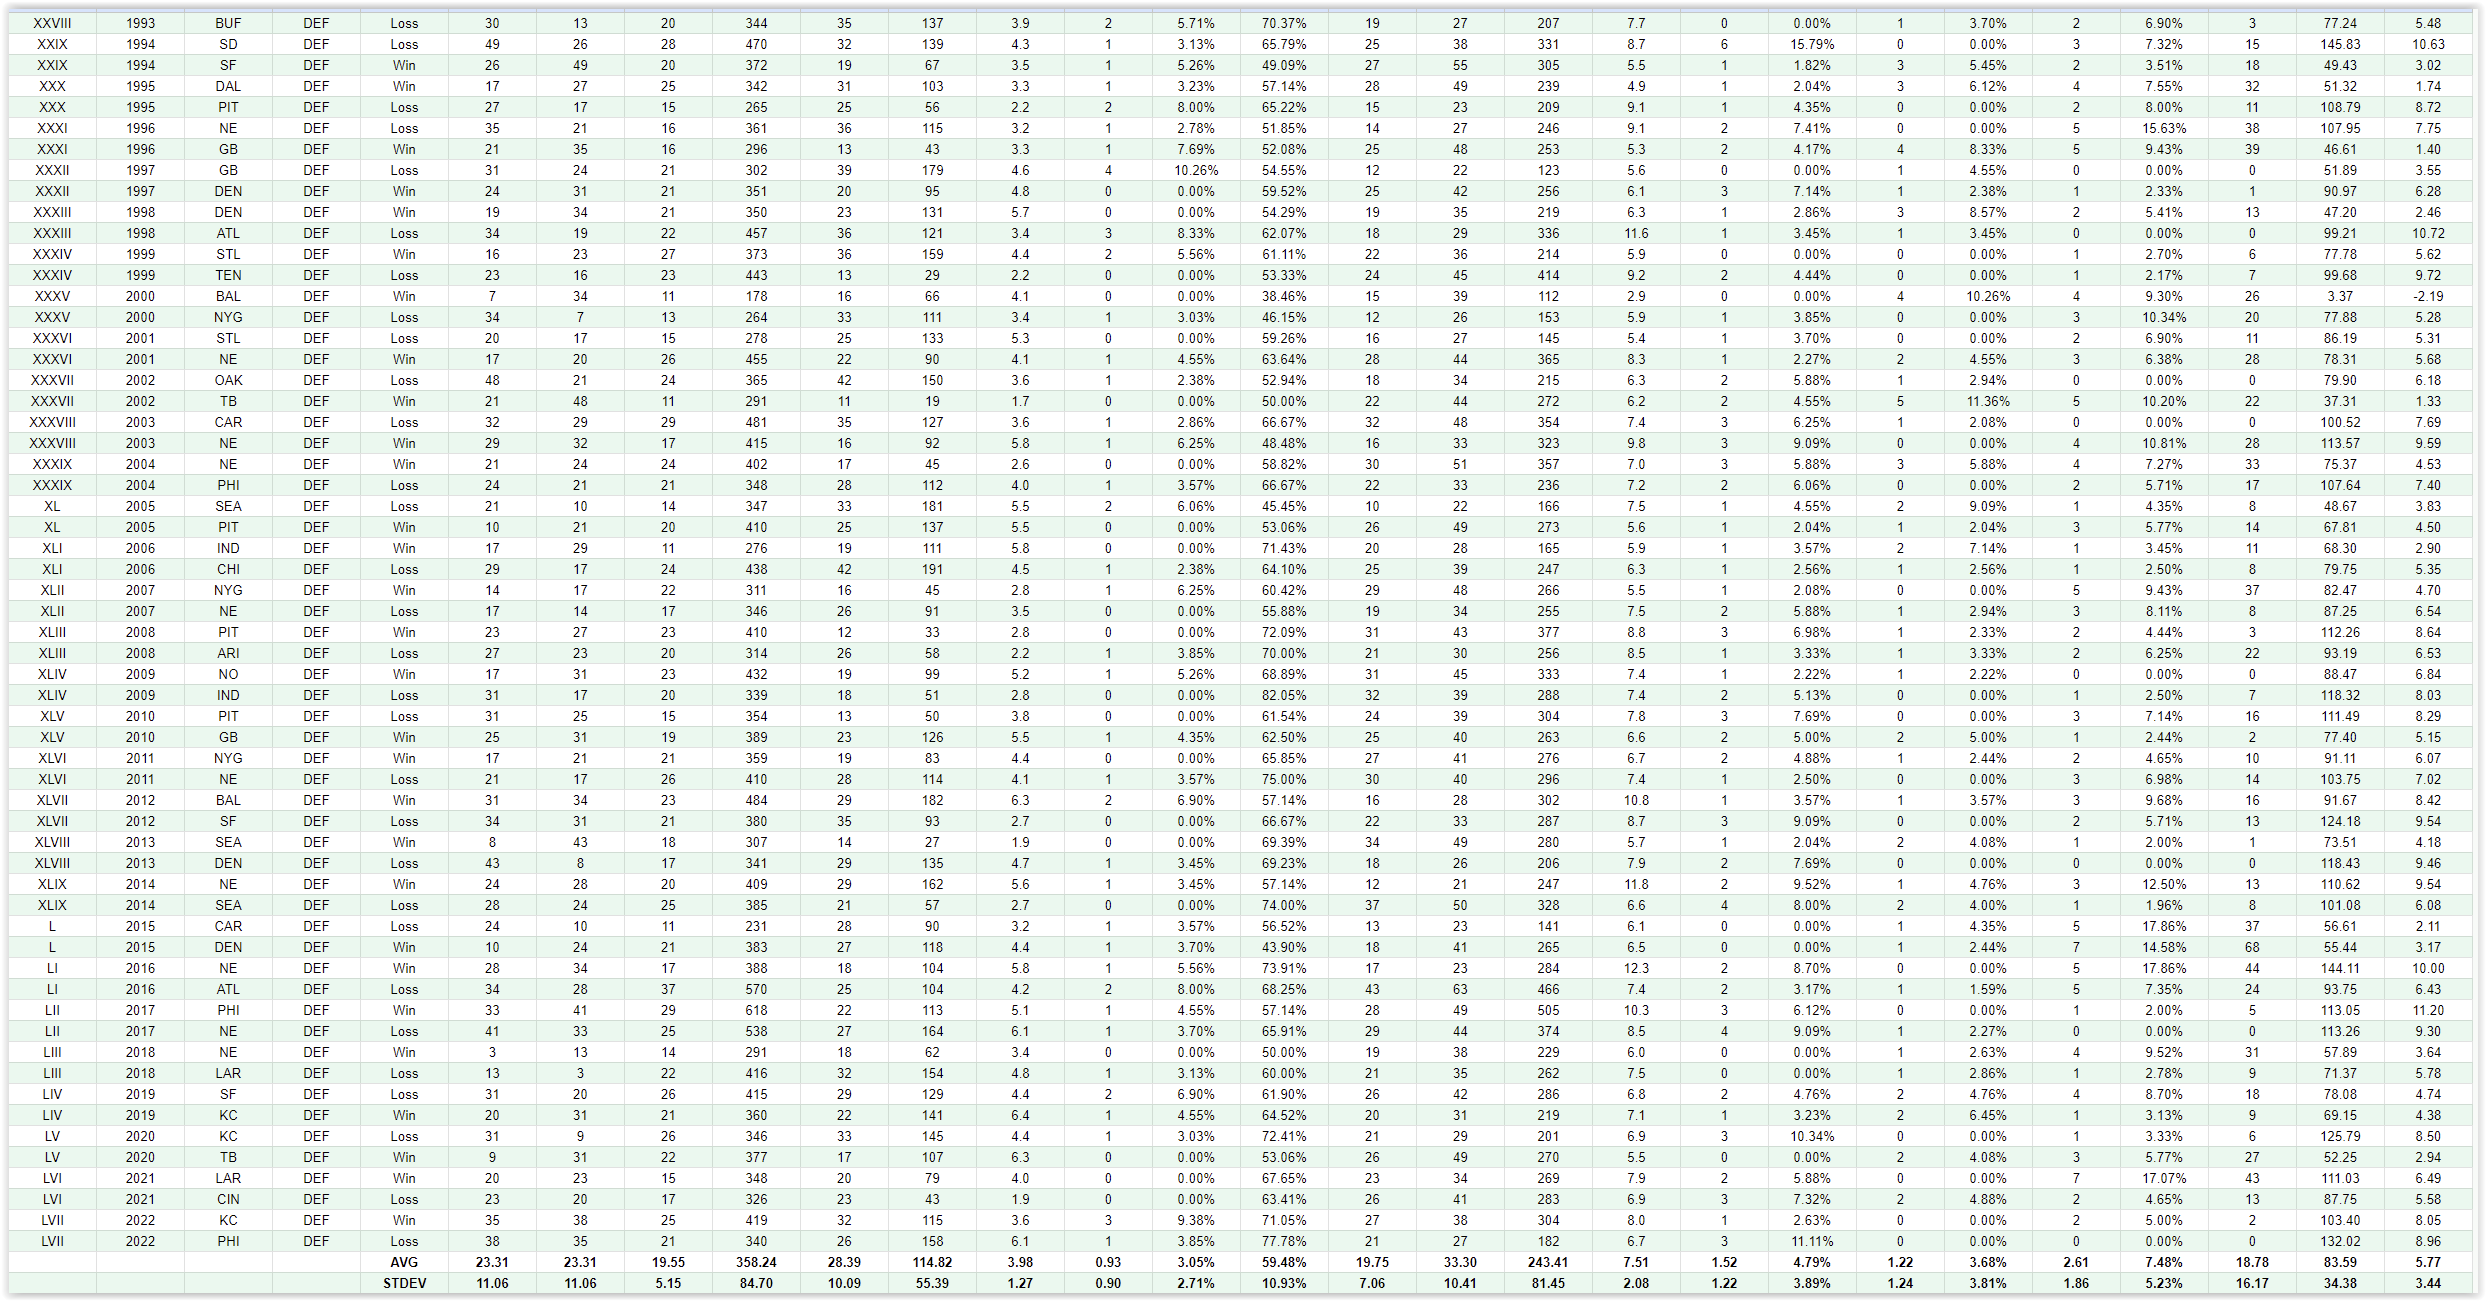
Bottom 10 – Worst Super Bowl Team Defenses
- 1989 Denver Borncos
- 1987 Denver Broncos
- 1986 Denver Broncos
- 1994 San Diego Chargers
- 2016 New England Patriots
- 1984 Miami Dolphins
- 1992 Buffalo Bills
- 2017 Philadelphia Eagles
- 2016 Atlanta Flacons
- 2017 New England Patriots
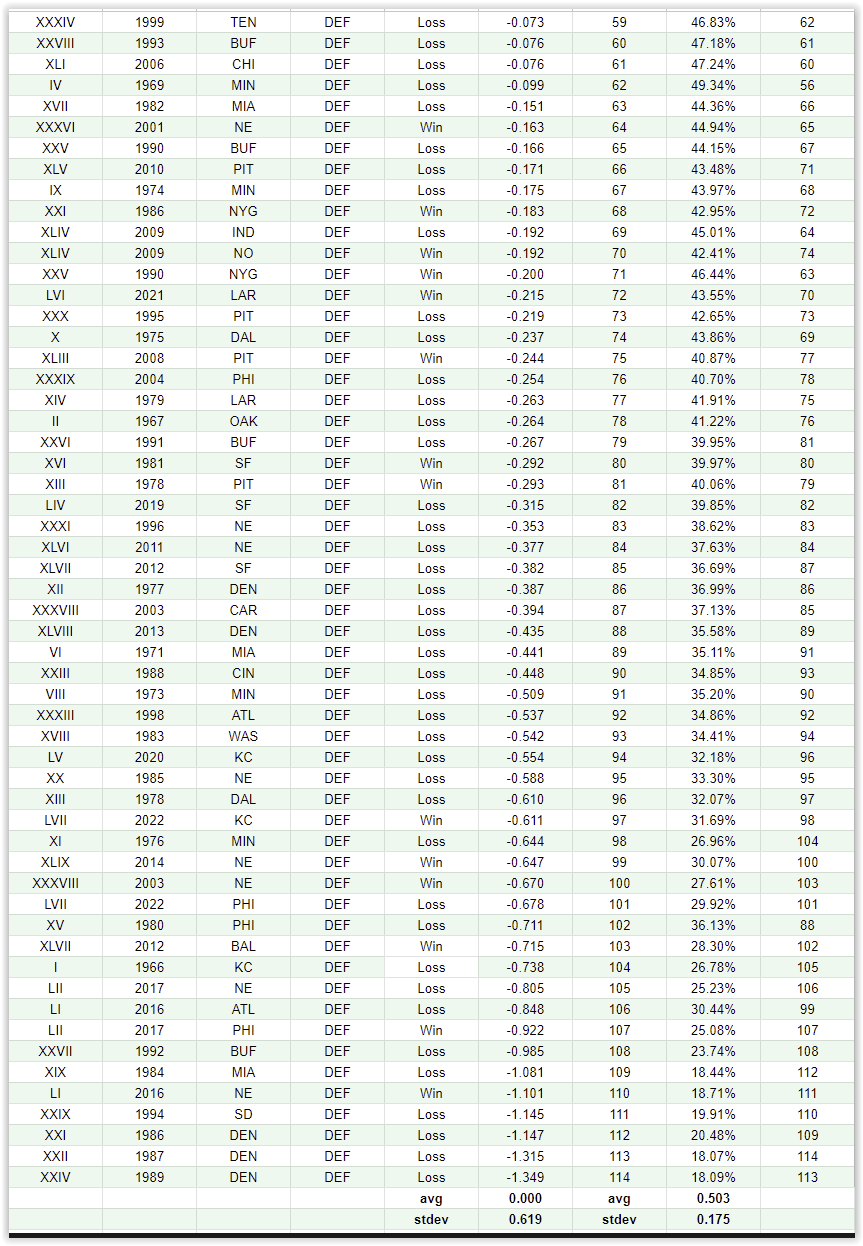
Standard Deviation Scale
Here is a simple breakdown for standard deviation units(SDU)
Outstanding = 2.00+
Good To Great = 1.01+ thru 2.00
Average to Good = 0.00 thru 1.00
Average to Poor = 0.00 thru -1.00
Poor to Very Poor = -1.01 thru -2.00
Abysmal = -2.01 & Below