NFL 2024 – Improbability Index
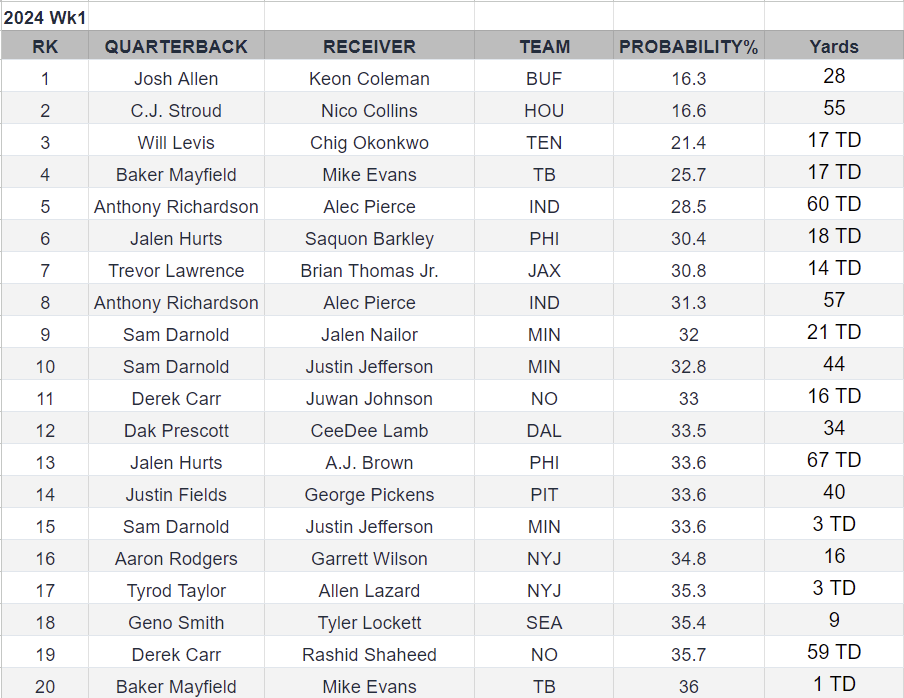
There aren’t many stats to analyze after week 1, so let’s have a little fun and look at NFL Next Gen Stats pass probability %. Each week the NFL posts the 20 passes with the lowest probability of completion. Below is the chart for 2024 Week 1.
2024 Week 1 Lowest Probability %
Next Gen Stats Tracking
Here is the explanation for improbable completions on the next gen stat page.
Using Next Generation Stats (aka Next Gen Stats) tracking data, we built a machine learning model that determines the probability of a pass being completed, and we named that stat Completion Probability. The machine learning model takes into account Next Gen Stats such as Air Distance, Air Yards, Receiver Separation. It also leverages other previously unrecorded metrics such as receiver distance from sideline, and more. Improbable Completions looks at passes with the lowest Completion Probability each week with a minimum of 10+ air yards, and all scoring plays.
Improbability Index
The NFL chart takes into account only the probability of the pass being completed for the chart rankings. However they do include the yardage and whether the completion resulted in a TD or not. What if we could use the yardage info to create a simple measure of improbability that takes into account both the probability of completion AND the length of the play? Whether the play resulted in a TD will not be factored into to the Improbability Index.
In theory, the most improbable play would be a 99 yard reception with a 1% chance of completion. The NFL probability % does go into tenths of a %, but the lowest probability since 2018 is 3.2%, so using 1% as opposed to 0.1% in the example seems fair enough. At the other end of the scale, the most probable of completions would be a 1 yard pass with a 99% chance of completion.
So if we used simple division let’s look at our two extreme cases using Yards / Probability %. We can just automatically multiply the probability % by 100 so we can just drop the % sign.
99 (yards) / 1 (probability %) = 99
1 (yards) / 99 (probability %) = 0.01
So our Improbabilty scale would run from 0.01 – 99. If there was ever a 0.1% probability completion for 99 yards, the Index would simply scale up to 999. Likewise, if a 1 yard pass were ever completed with a 99.9% probability, the Index would simply scale down to 0.001. Effectively we are looking at a ratio of Yards / Probability Point.
So let’s apply this simple division to the 2024 Week 1 Chart. The results are below.
2024 Improbability Index – Week 1
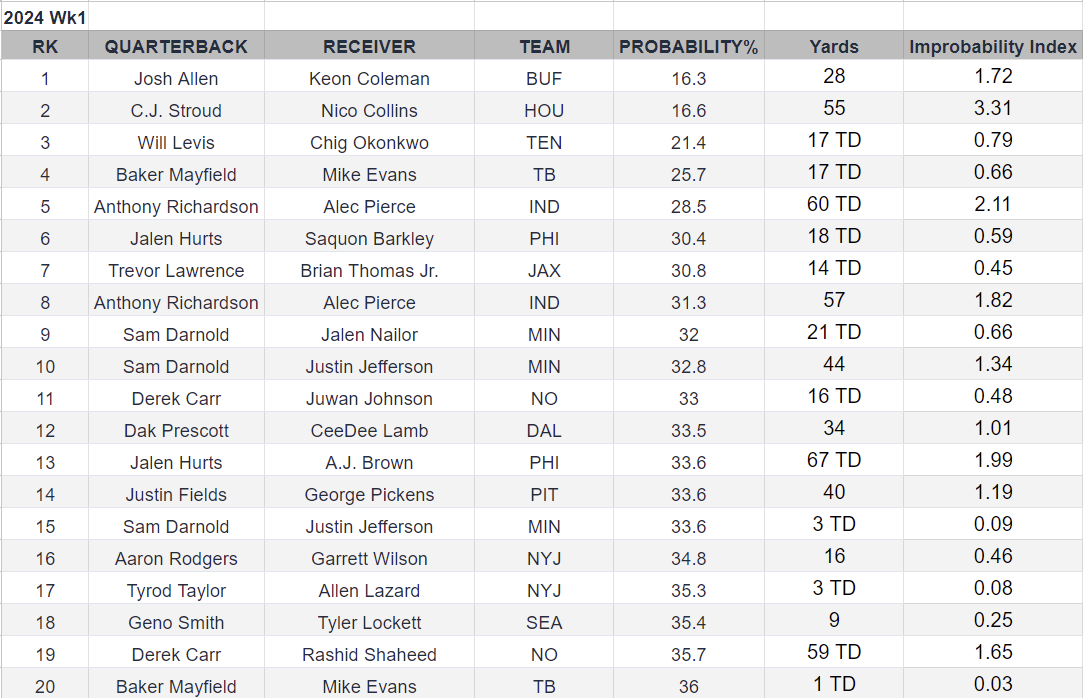
The three passes ranked 13th – 15th all had a probability of 33.6%. The Index rated the 67 yard pass 1.99, the 40 yard pass 1.09, and the 3 yard pass 0.09. So at least when rating passes with the same probability the Improbability Index does seem work.
By Improbability Index, the most improbable completion of Week 1 was C.J. Stroud’s 55 yard completion to Nico Collins that had a probability % of 16.6% (55 / 16.6 = 3.31). The Top 5 Improbability Index most improbable completions in Week 1:
- Stroud 16.6% to Collins 55 yards
- Richardson 28.5% to Pierce 60 yards
- Hurts 33.6% to Brown 67 yards
- Richardson 31.3% to Pierce 57 yards
- Allen 16.3% to Coleman 28 yards
The Improbability Index’s most probable of the least probable according to the index:
- Mayfield 36% to Evans 1 yard
- Taylor 35.3% to Lazard 3 yards
- Darnold 33.6% to Jefferson 3 yards
Historical Improbability Index
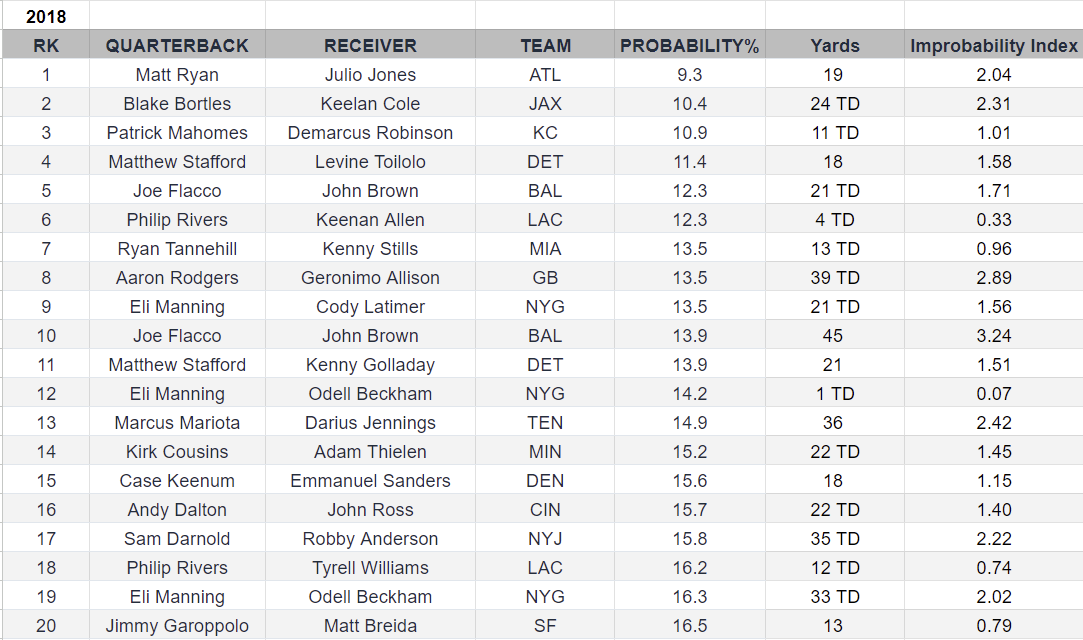
NFL Next Gen Stats were not allowing the pull of weekly stats for previous years save for the top 20 from each year. Perhaps a server or db issue, but if it allows weekly pulls from previous years we can always go back are run the data. So given that limitation, here are the top 20 Improbability Index scores from each year 2018 -2023. Again remember we are now limited to the top 20 most improbable completions from each year based solely on the completion %.
2018 Improbability Index
2019 Improbability Index
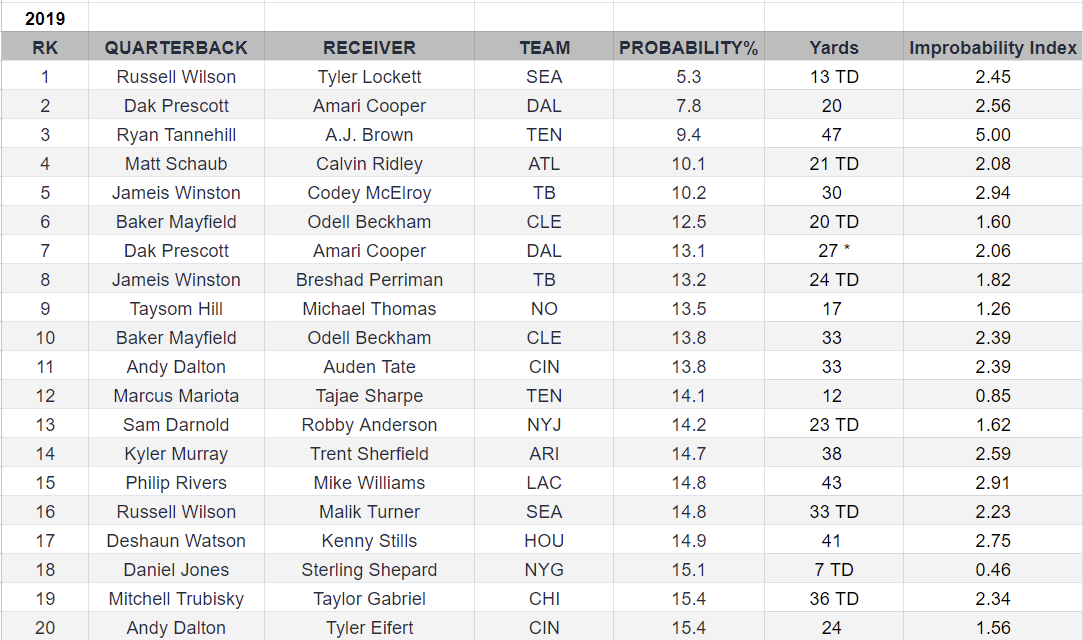
2020 Improbability Index

2021 Improbability Index
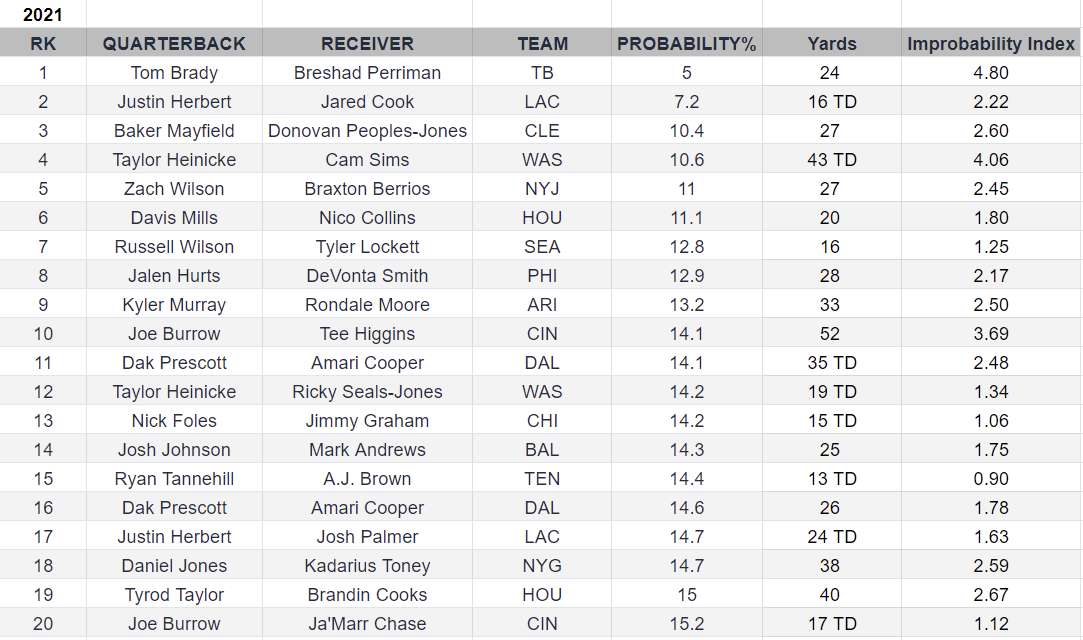
2022 Improbability Index
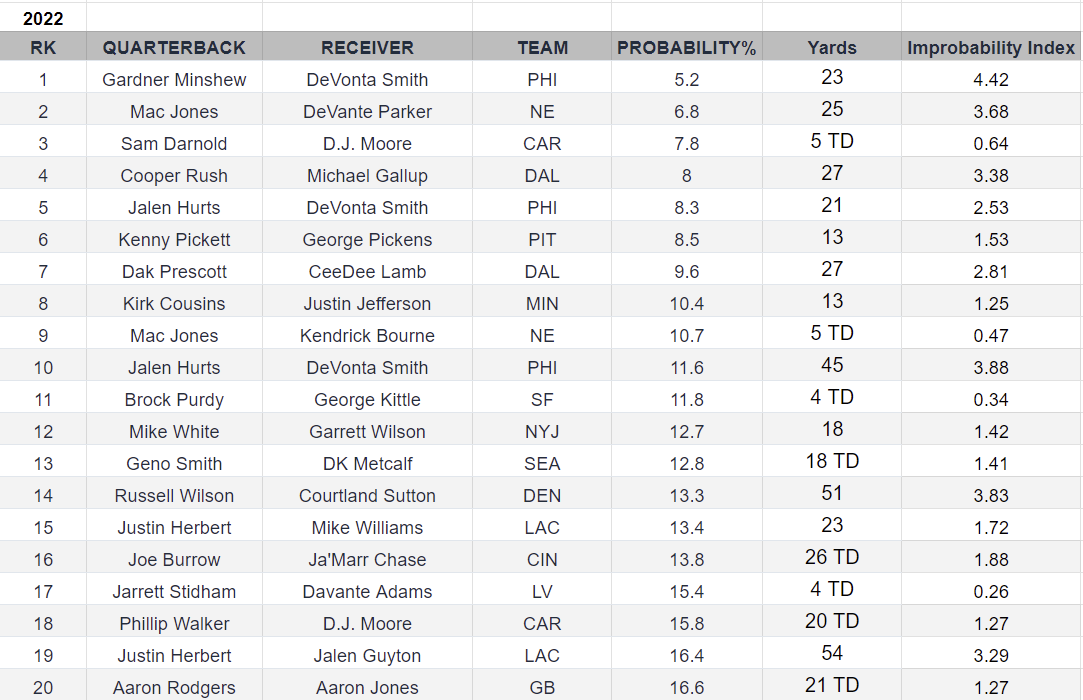
2023 Improbability Index

The Most Improbable Of The Most Improbable
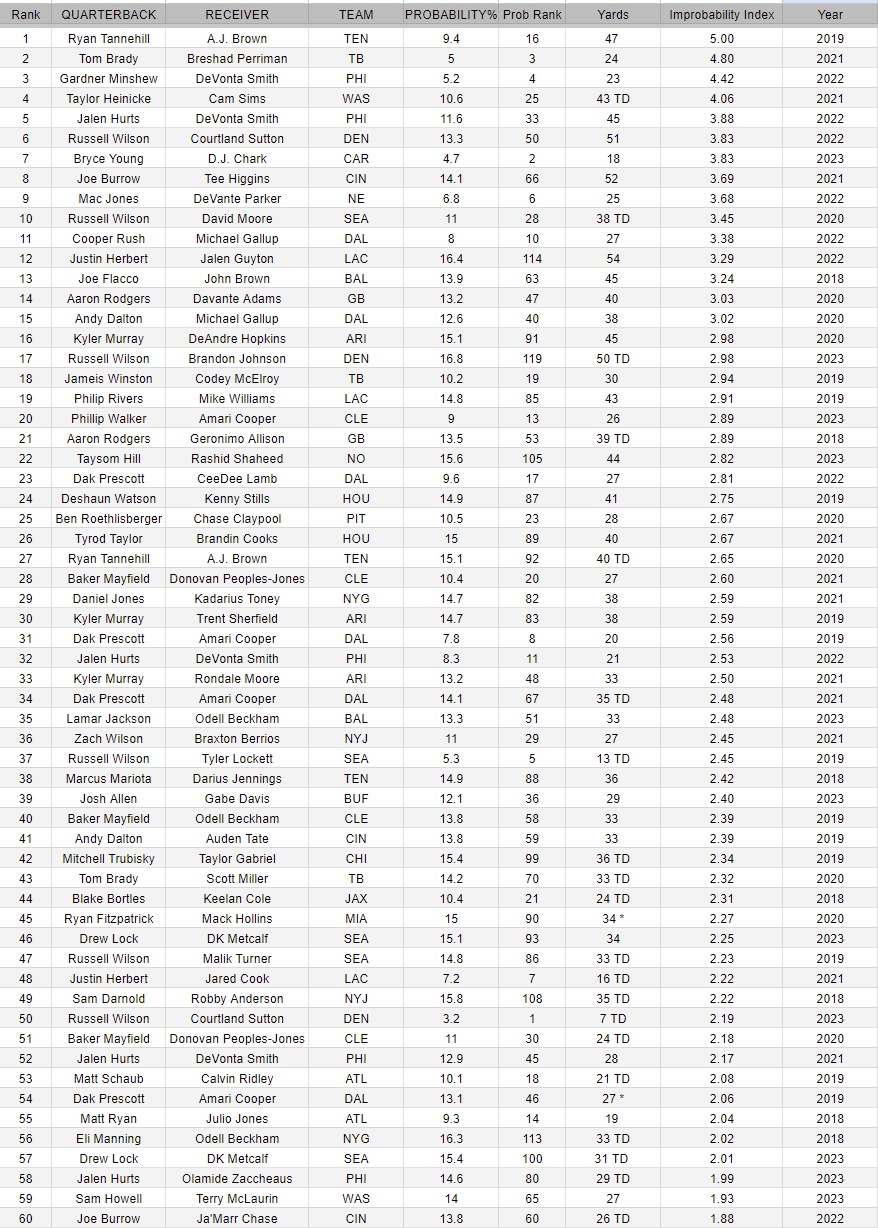
So given the top 20 for each year 2018 – 2023, we end up with 120 of the most improbable passes in the NFL. Applying the Improbability Index to the list of 120 allows us to get a Top 20 for the years 2018 -2023, or every year the stat has existed. Below is the list which includes the year it occured.
2018 – 2023 Improbability Index Top 20
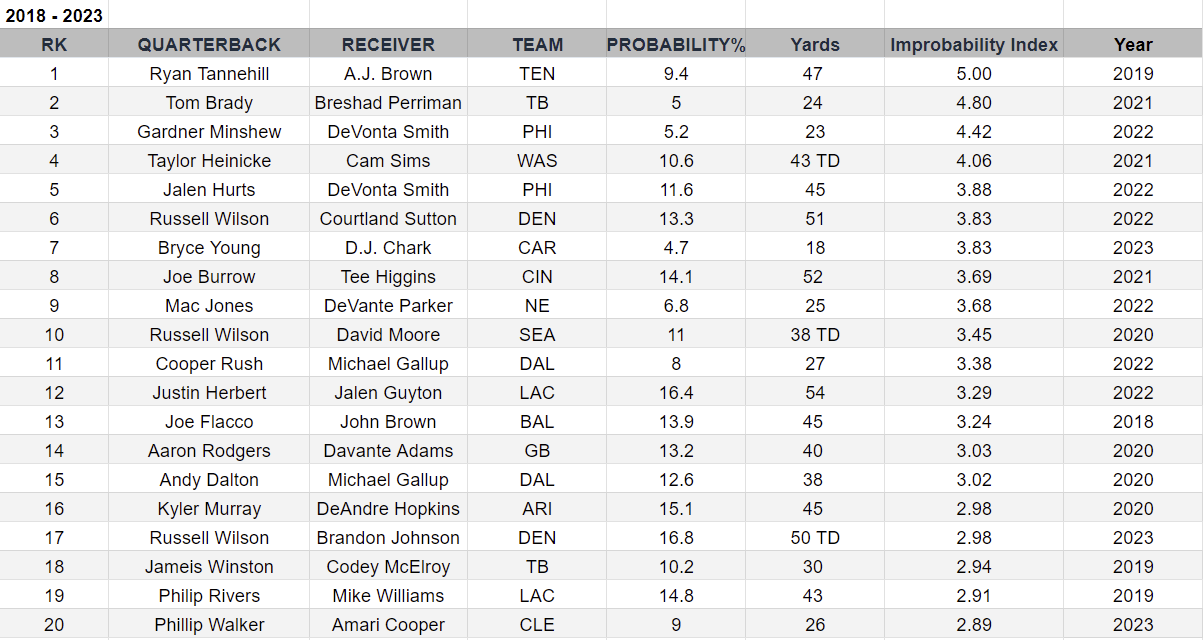
When comparing passes with different probabilities, we have a few we can check by working backwards and finding passes with the same Improbability Index score. There are two occurances in the Top 20 chart.
R Wilson (13.3%) to Courtland Sutton (51 yards), and Bryce Young (4.7%) to D.J. Chalk (18 yards) both score 3.83 on the Improbability Index. If you divide WIlson’s 13.3% and Sutton’s 51 yards by 2.833, you get a completion probability of 4.694% and a 18 yard completion. Young’s pass to Chalk was a 4.7% probability and went for 18 yards.
Kyler Murray (15.1%) to DeAndre Hopkins (45 yards), and Russell Wilson (16.8%) to Brandon Johnson (50 yards) both scored 2.98 on the Index. If we multiply the probability and yardage from the Murray to Hopkins pass by 1.111, we get a completion probability 16.777% and a completion for 50 yards. It appears that the Index also fairly compares passes with different probability percentages and yardage.
Based on the Top 20, a pass with a probability below 16% that results in a yardage gain 3x – 5x the probability, would qualify as one of the most improbable passes recorded since 2018.
From 2024 Week 1, one pass was improbable enough to crack the Top 20. Stroud to Collins scored 3.31 on the Improbability Index placing it as the 12th most improbable pass. This knocks out the Phillip Walker 9% to Amari Cooper 26 yard (2.89) effort in 2023. The updated chart is below.
2018 – 2024 Improbability Index Top 20

The Improbability Index Quarterback List
The 5 times listed for QUARTERBACK are just headers that were counted in the pivot table so just ignore them. Players from Week 1 of 2024 are not included.
That makes the most improbable quarterback Russel Wilson with 8 appearances. Dak Prescott is second with 5 improbable completions. The list of QBs with 4 is a long one: Rodgers, Dalton, Mayfield, Hurts, Burrow, Flacco, Herbert, Murray, Tannehill.
What about some big names who have been active for most of the period? Josh Allen 1, Lamar Jackson 1, Patrick Mahomes 2. Kirk Cousins 2.
Improbablity Index Quarterback List 2018 – 2023

Improbablity Index Receiver List 2018 – 2023
The 5 times listed for RECEIVERS are just headers that were counted in the pivot table so just ignore them. Players from Week 1 of 2024 are not included.
Amari Cooper leads the list with 6. Odell Beckham Jr has 5. Devonte Smith has 4. This list of receivers with 3 improbable receptions is short: A.J. Brown, D.J. Chalk, Davante Adams, DK Metcalf, Tyler Lockett. Having initials as a receiver seems to increase the chance of the improbable.

Lowest Probability % 2018 -2023
If you think the Improbability Index is complete nonsense and you just want to go by completion %, here is the list of 120 passes ranked by completion %.

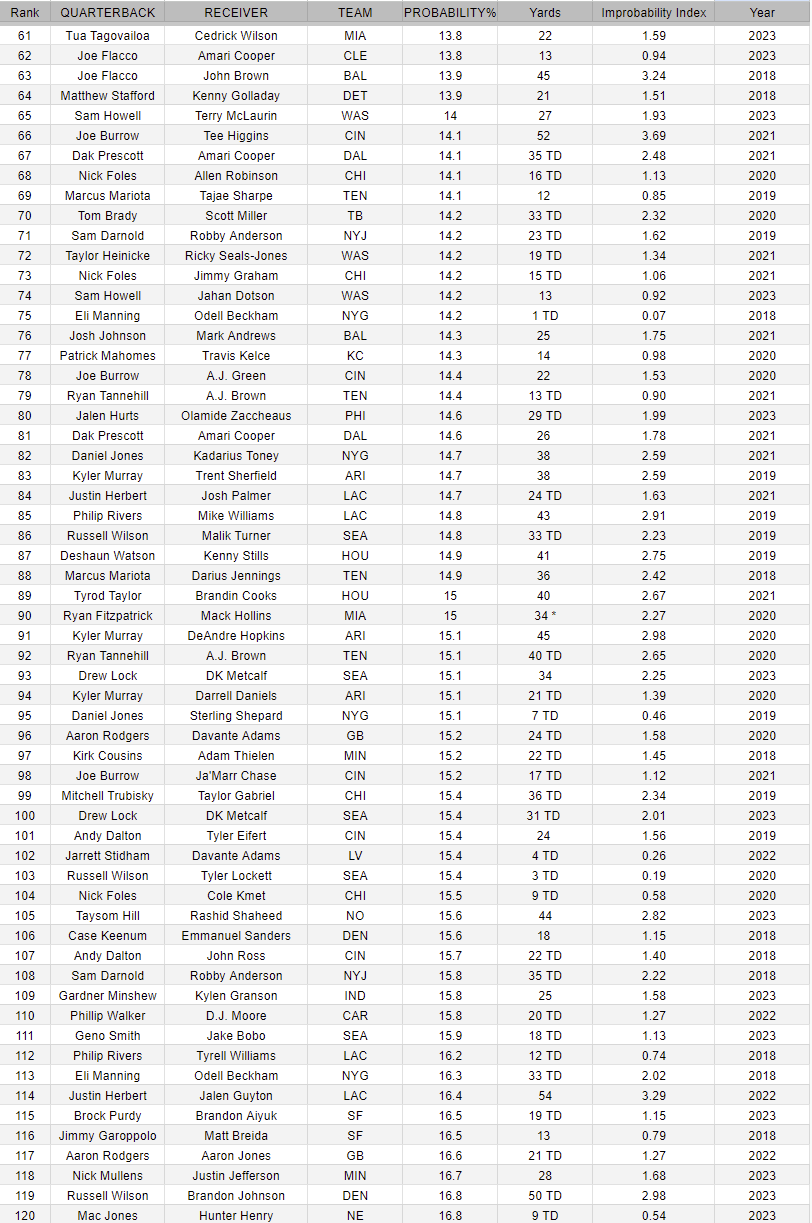
Improbability Index 2018 -2024 by Index Value
In the chart below you can see Improbability Index Rank & Probability % rank. Receptions ranked 2nd, 3rd, 4th, 6th, 10th, 16th, & 19th by probability appear in the Top 20 by Improbability Index. The most improbable reception by completion probability, Russell Wilson (3.2%) to Courtland Sutton (7 Yards), ranks 50th.
There have only been 17 qualifying passes recorded with a completion probability below 10% since 2018. The other 103 fall between 10% – 16.8% probability. Since probability % is often so close between recpetions, yardage ends up being the determining factor in close calls. Thus longer passes tend to be near the top of the Index and shorter passes at the bottom.
