
NFL 2023 – Short Yardage Offense & Defense
Here is a look at every NFL team’s performance in short yardage situations which will be defined as 3 yards or less. We will look at the data in two sets: Short Yardage performance on any down & Short Yardage performance on 3rd & 4th down plays.
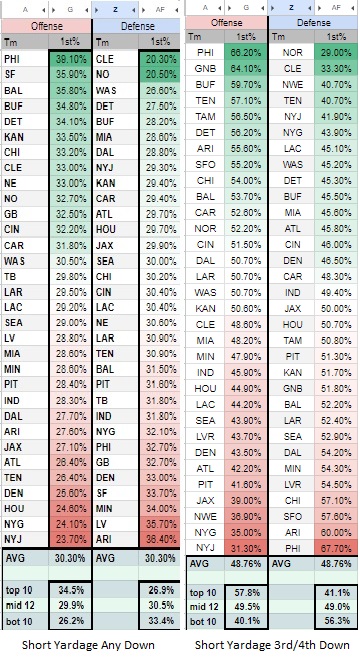
Short Yardage Offense & Defense On Any Down


Correlation is a mathematical way of comparing two sets of data to see if they trend in similar ways. Correlation values run from -1 to +1. A value of zero says there is no correlation between the two sets of data. The appear as perfectly random with nothing in common.
A value of 1 would mean perfect correlation; that is if a value in a cell from one set of data is high, the value of the corresponsing cell in the other data set will also be high. To achieve a +1 correlationl, every data value must correlate perfectly.
A value of -1 correlation means that the value of the corresponding cell does the exact opposite. If the first cell had a high number, the corresponding cell will have a low number. To achieve a -1 correlation, every data value must correlate exactly opposite.
That just leaves all the values between -1 and +1 besides zero which we already noted means no correlation whatsoever. Here is a simple chart that explains the range of values and how to interpret them.
| Correlation coefficient | Correlation strength | Correlation type |
|---|---|---|
| -.7 to -1 | Very strong | Negative |
| -.5 to -.7 | Strong | Negative |
| -.3 to -.5 | Moderate | Negative |
| 0 to -.3 | Weak | Negative |
| 0 | None | Zero |
| 0 to .3 | Weak | Positive |
| .3 to .5 | Moderate | Positive |
| .5 to .7 | Strong | Positive |
| .7 to 1 | Very strong | Positive |
So let’s look first at the correlation of 1st % by offenses. I sorted this column from highest to lowest. If we were to correlation this column against itself, it would score a value of +1. This is noted on the chart at the bottom with the other correlation values and which shows the columns being compared.
The other control columns for offense are the 1st downs and the punts columns. We should expect very strong correlation between 1st down % and amount of first downs(0.9), and a negative relationship between 1st down % and amount of punts(-0.5) which we see.
We should also probably see correlation between how many yards the team picked up and 1st down %(0.6), as well as how many extra yards they pick up on average and 1st down %(0.5) which again we see. However interestingly, there is very small correlation between how far the team has to go and 1st down % which means that the teams picking up the most first downs are fairly immune to how far it is to go to get it.
When looking at team performance on any down, we can see a decent correlation between offenses that rush the ball more often having a higher 1st down %. This is indicated by the 0.4 correlation score between the two sets of values(1st down % and rushing %).
On the defensive side, it would appear as if a strong defense will stop the run and pass equally. In fact there is very little correlation on defense outside the controls of 1st downs allowed and punts forced. Essentially a good defense is good in all short yardage situations while a bad defense is bad.
Philadelphia and San Francisco top the offense list for 1st down % while the Giants and Jets are the bottom. Defensively, Cleveland &New Orleans have the lowest first down % against, while Arizona and Las Vegas bring up the rear on defense.
3rd & 4th Down and Short Yardage
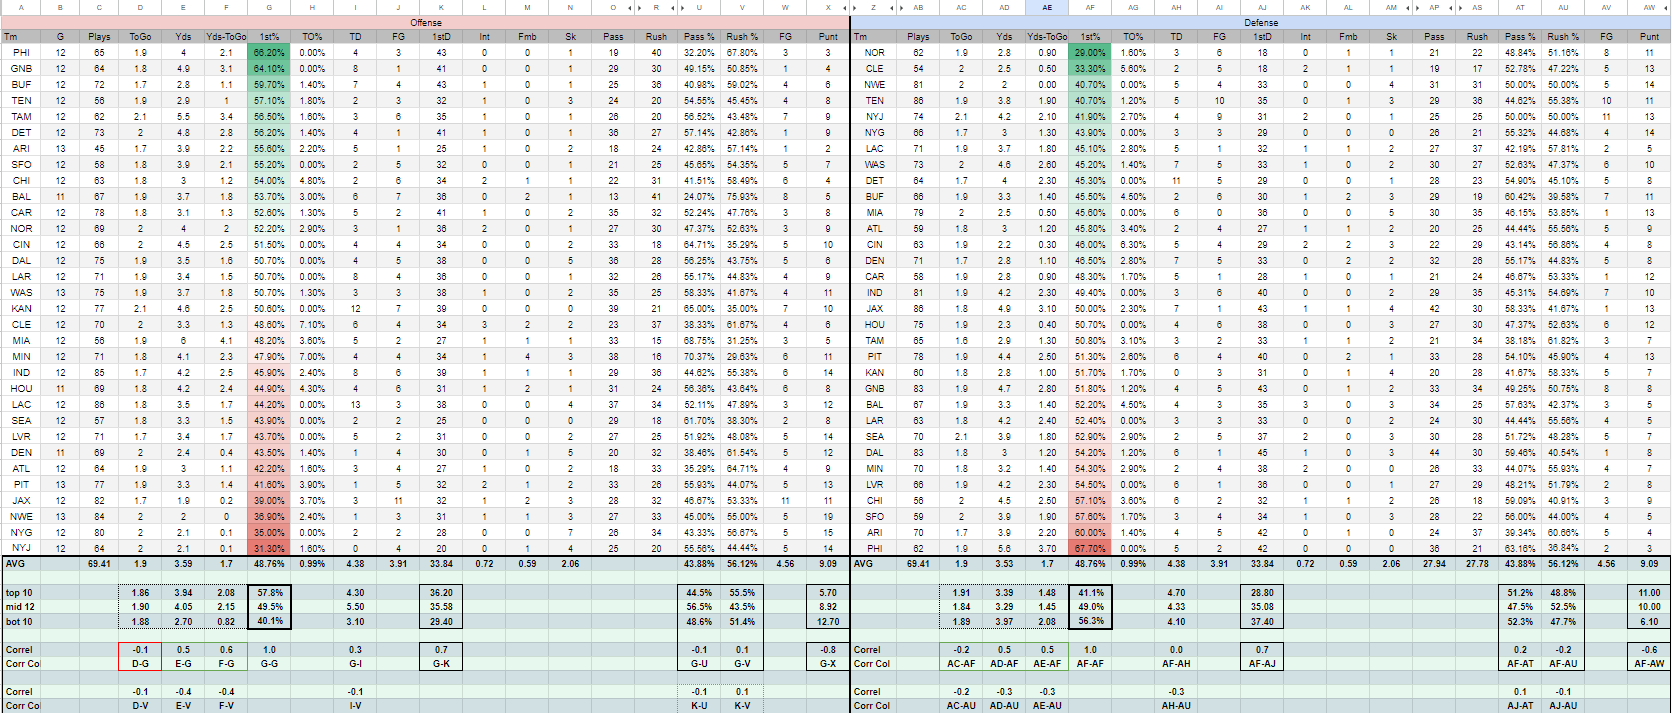

When looking at just 3rd and 4th down short yardage situations, the correlations are pretty straightforward. We have the controls again of amount of 1st downs(0.7) and amount of punts (-0.8). The punt being so high a negative correlation is due to it being 3rd or 4th down as opposed to any down.
Again we see positive correlation between yards to go and yards exceeded for both offense and defense. Outside of those correlations, there is very little correlation in any of the data. Again this is suggesting that there is no real direct causual effect that increases or decrease 1st down %. In fact if you look at the top 10 offenses for 1st down %, the top 3 do it by rush, teams 4-6 prefer the pass, and teams 7-10 prefer to rush.
We also see the same thing on defense. A good short yardage defense is good against rush and pass regardless of the yardage to go.
Philadelphia has the best 3rd/4th down short yardage offense(66.2%) and the worst 3rd/4th down defense(67.7%). The Giants & Jets both sit at the bottom of the offense list again. New Orleans & Cleveland still rule the defenses, while Arizona and San Francisco also struggle defensively in 3rd/4th & shot situations.