
NFL Draft Trade Chart – Comparing, Contrasting, & Synthesizing NFL Draft Trade Charts
With the NFL draft coming up, let’s take a look at four well known NFL Draft Trade Charts. The 4 most popular draft trade charts are:
- The Johnson Draft Trade Chart – Used by Cowboys coach Jimmy Johnson
- The Hill Draft Trade Chart – Rich Hill’s Draft Trade Chart
- The Fitzgerald-Spielberger Draft Trade Chart – OTC’s attempt at a trade chart
- The Chase Stuart Draft Trade Chart – Footballperspective.com
READ MORE: NFL 2024 Pre Draft Trade Analysis – The Value of Traded Players
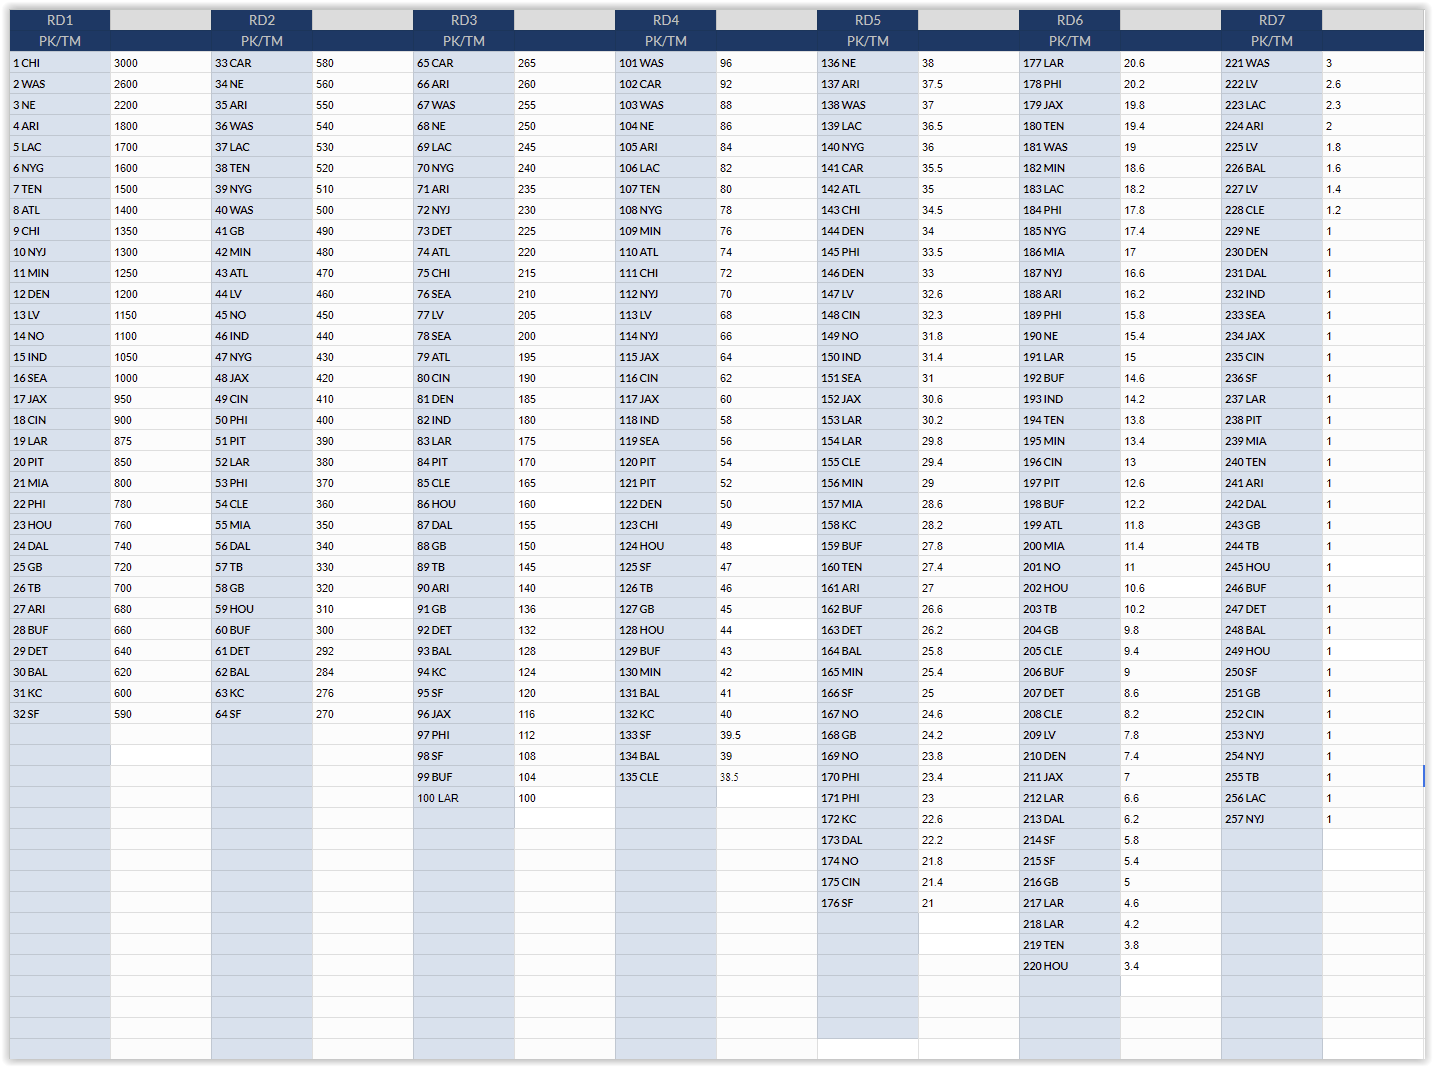
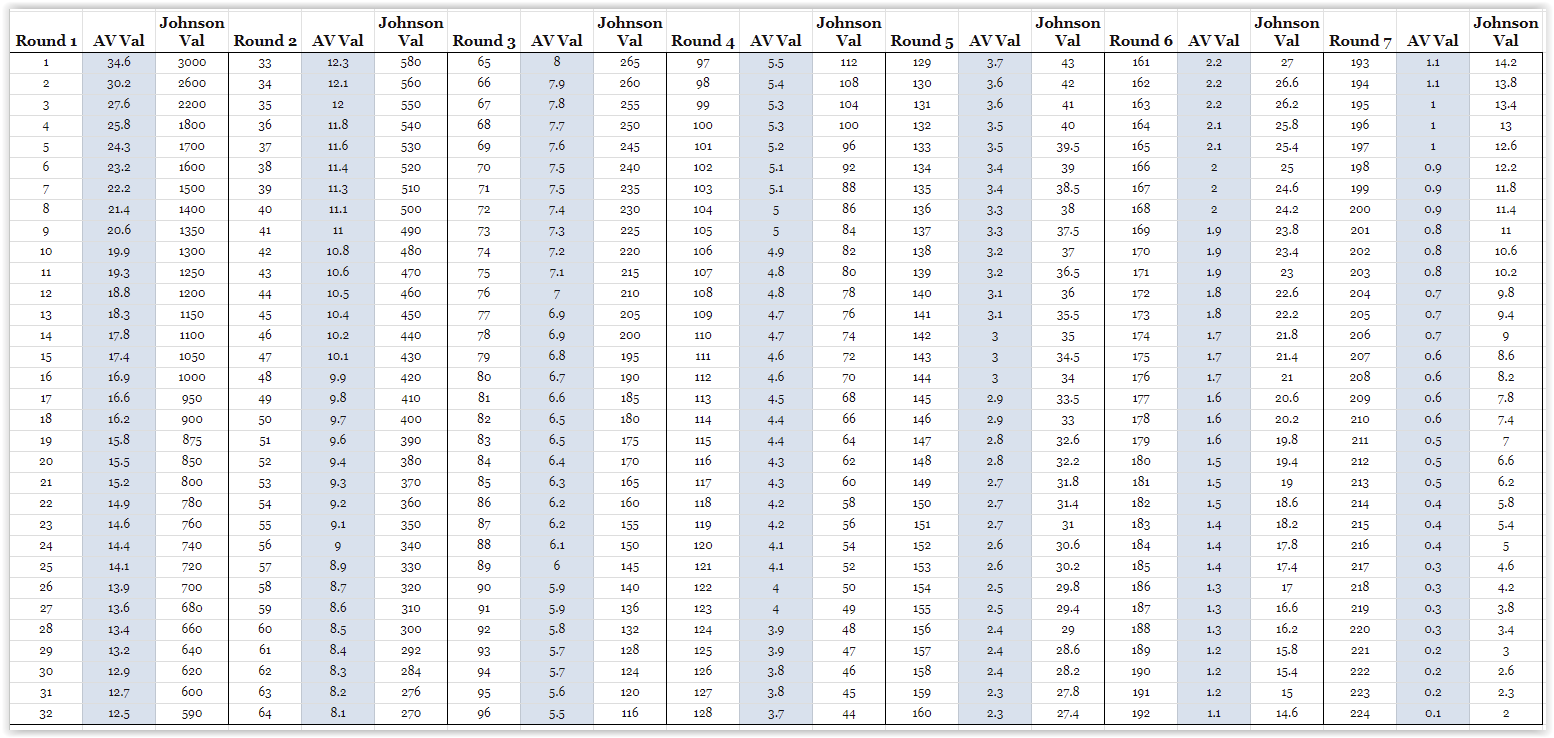
NFL Johnson Draft Trade Chart
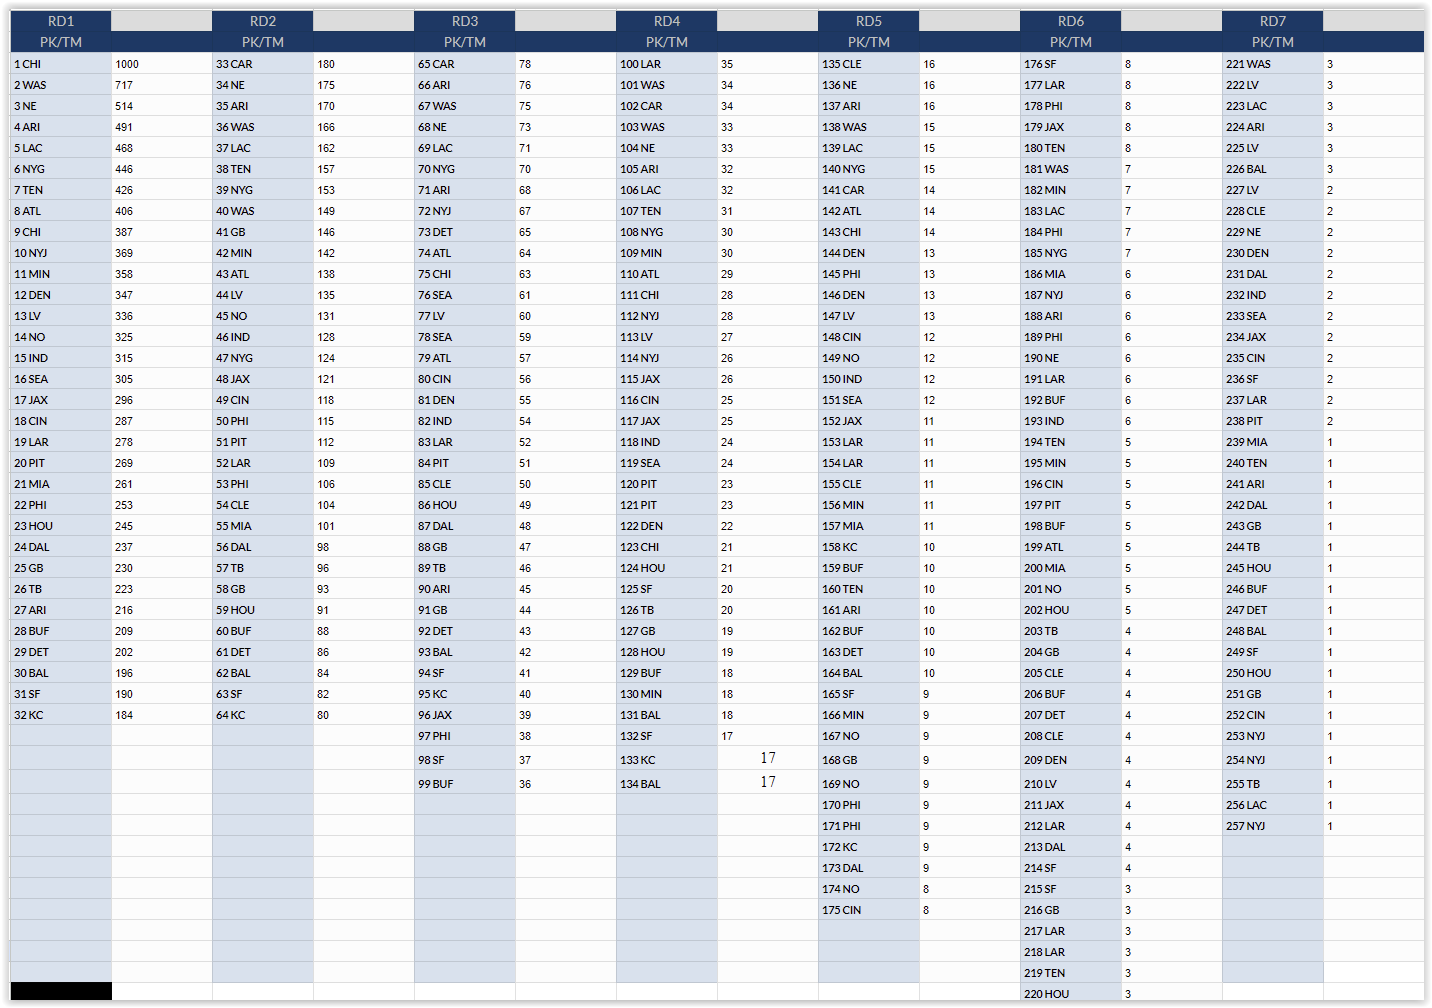
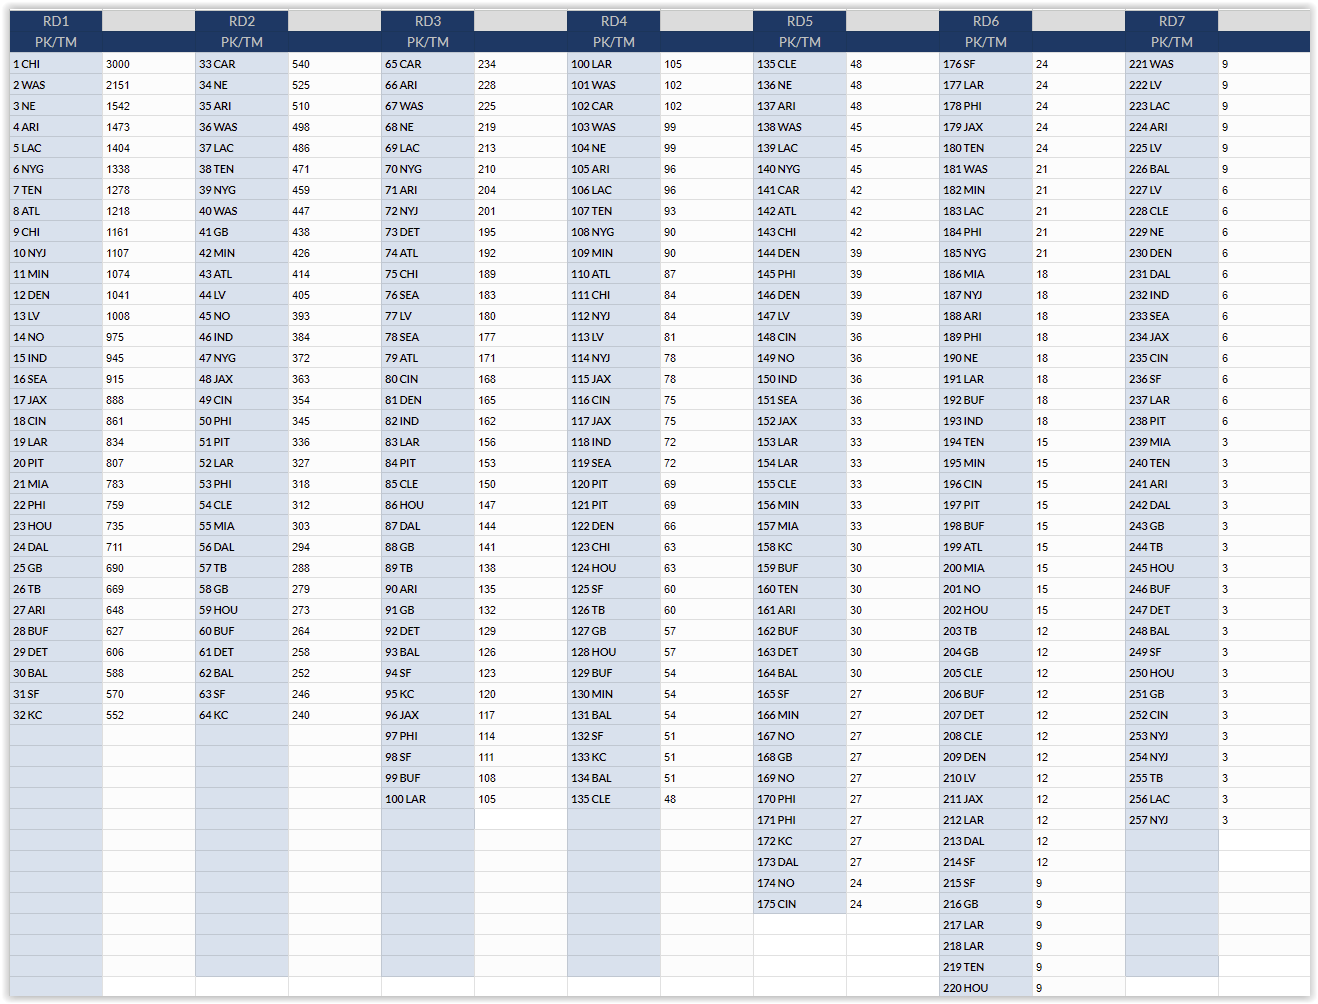
NFL Hill Draft Trade Chart
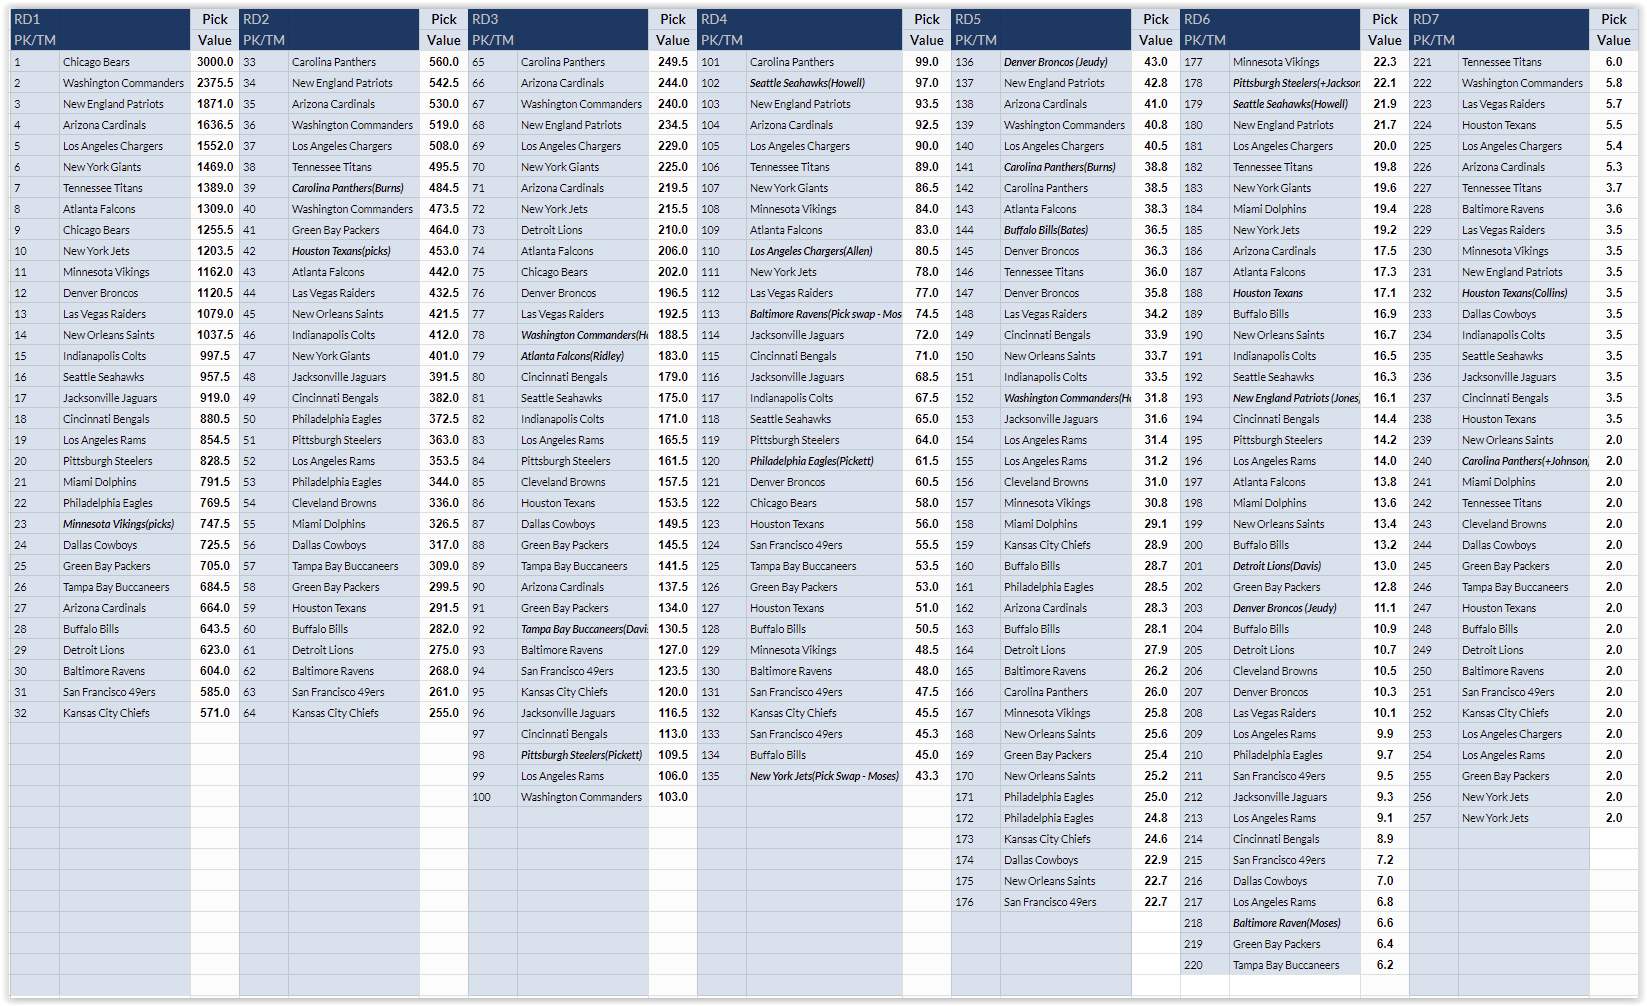
NFL Fitzgerald-Spielberger Draft Trade Chart
The Chase Stuart Draft Trade Chart
Eliminating Fitzgerald & Chase Stuart Charts
Now I am going to do something rash, and throw out both the Fitzgerald-Spielberger & Chase Stuart charts before going any further.
Here is the reasoning for tossing the Fitzgerald-Spielberger Chart:
In the Fitzgerald-Spielberger chart Picks #250 – #257 have a total value of 1560 points, the equivalent of the 17th pick in the draft.
Picks 250-257 are essentially the 8 best Undrafted Free Agents in the sense that after these 8 picks, the pool that is left is the UFA pool of players.
Would any GM trade the 17th pick in the draft for picks #250-#257? I am going to say no to this hypothetical, and hence I am throwing out the chart. It simply doesn’t seem ideal for the purpose and it does not play well with the other two charts(something that will be important later on).
The reasoning for the eliminating the Chase Stuart chart is a combination of the simplistic and complex. The simple reason is that is does not account for compensatory picks, however I am sure it could be(or has been, although I could not find it). The more complex reason is that while it seems to be in favor by highly analytics based teams, it is better used for evaluating players than trading draft picks.
Here is a quote from a recent Bill Barnwell article examining the Steelers Kenny Pickett to Eagles pre-draft trade:
Using the Chase Stuart draft value chart, this rates out as the equivalent of the Steelers landing a pick in the middle of the sixth round. The more traditional Jimmy Johnson chart sees it like a late fourth-round selection. While teams use the latter chart to talk trade, most organizations have moved onto evaluating players using an evidence-based board like Stuart’s.
In 2019, WindyCityGridiron studied the charts and found the Chase Stuart chart to be the least accurate for trading. There were 23 trades that year. 14/23 fell within 5% of the Johnson chart values, 19/23 fell within 10%, and every trade fell within 20%. On the Chase Stuart chart only 2/23 trades fell within 5%, 3/23 within 10%, and 9/23 within 20%.
Barnwell analyzes the Vikings trade with Houston for the 23rd pick later in the same article. Barnwell calculated that the Vikings paid a 21% premium on the Johnson chart, but a 51% premium on the Chase Stuart Chart. Since we are seeking to create a draft trade chart, tossing the Chase Stuart chart seems to be best idea.
Although using the new draft trade chart to evaluate trades will be the focus of the next article, the Pickett trade was worth 48 points on the new trade draft chart which is equivalent to pick #130, a late 4th round pick.
Modifying the Hill Draft Trade Chart
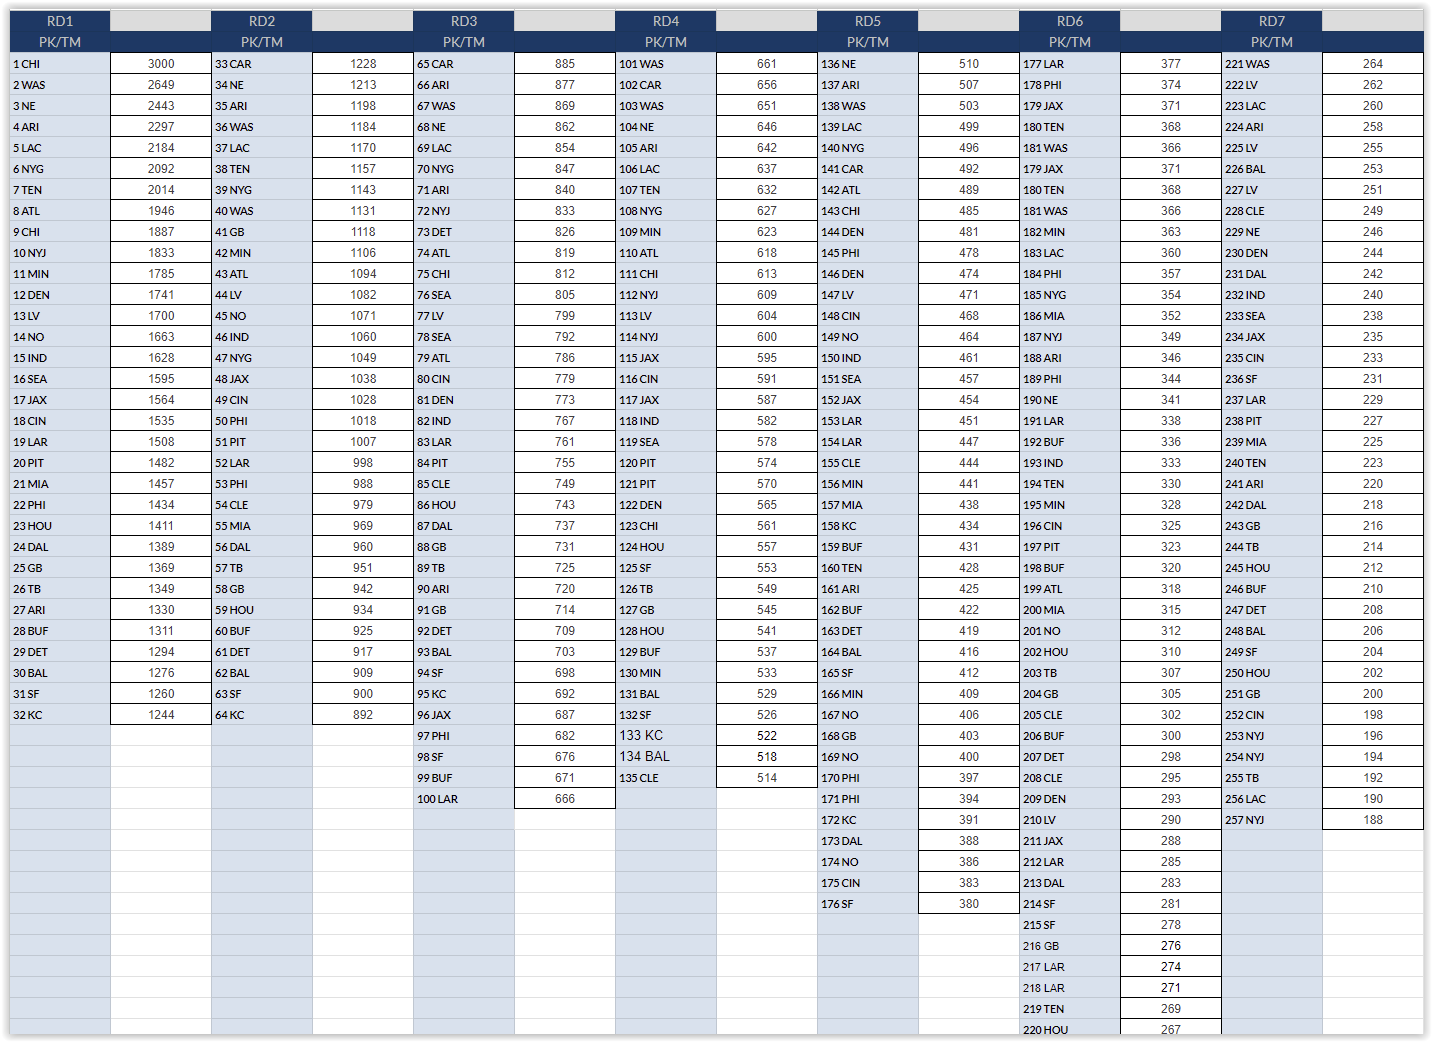
Next, let’s simply mulitply every value in the Hill Draft Trade Chart by 3. Since the 1st pick in the Hill chart is worth 1000, and in the Johnson chart it is worth 3000, by multiplying the Hill chart values by 3, we set the value of the 1st picks to be equal at 3000. Since we are multiplying every Hill chart value by 3, we are not changing any of the ratios between pick values, we are simply making it easier to compare to the Johnson chart.
Here are the two charts again, but this time all of the Hill chart values are multiplied by 3.
NFL Johnson Draft Trade Chart
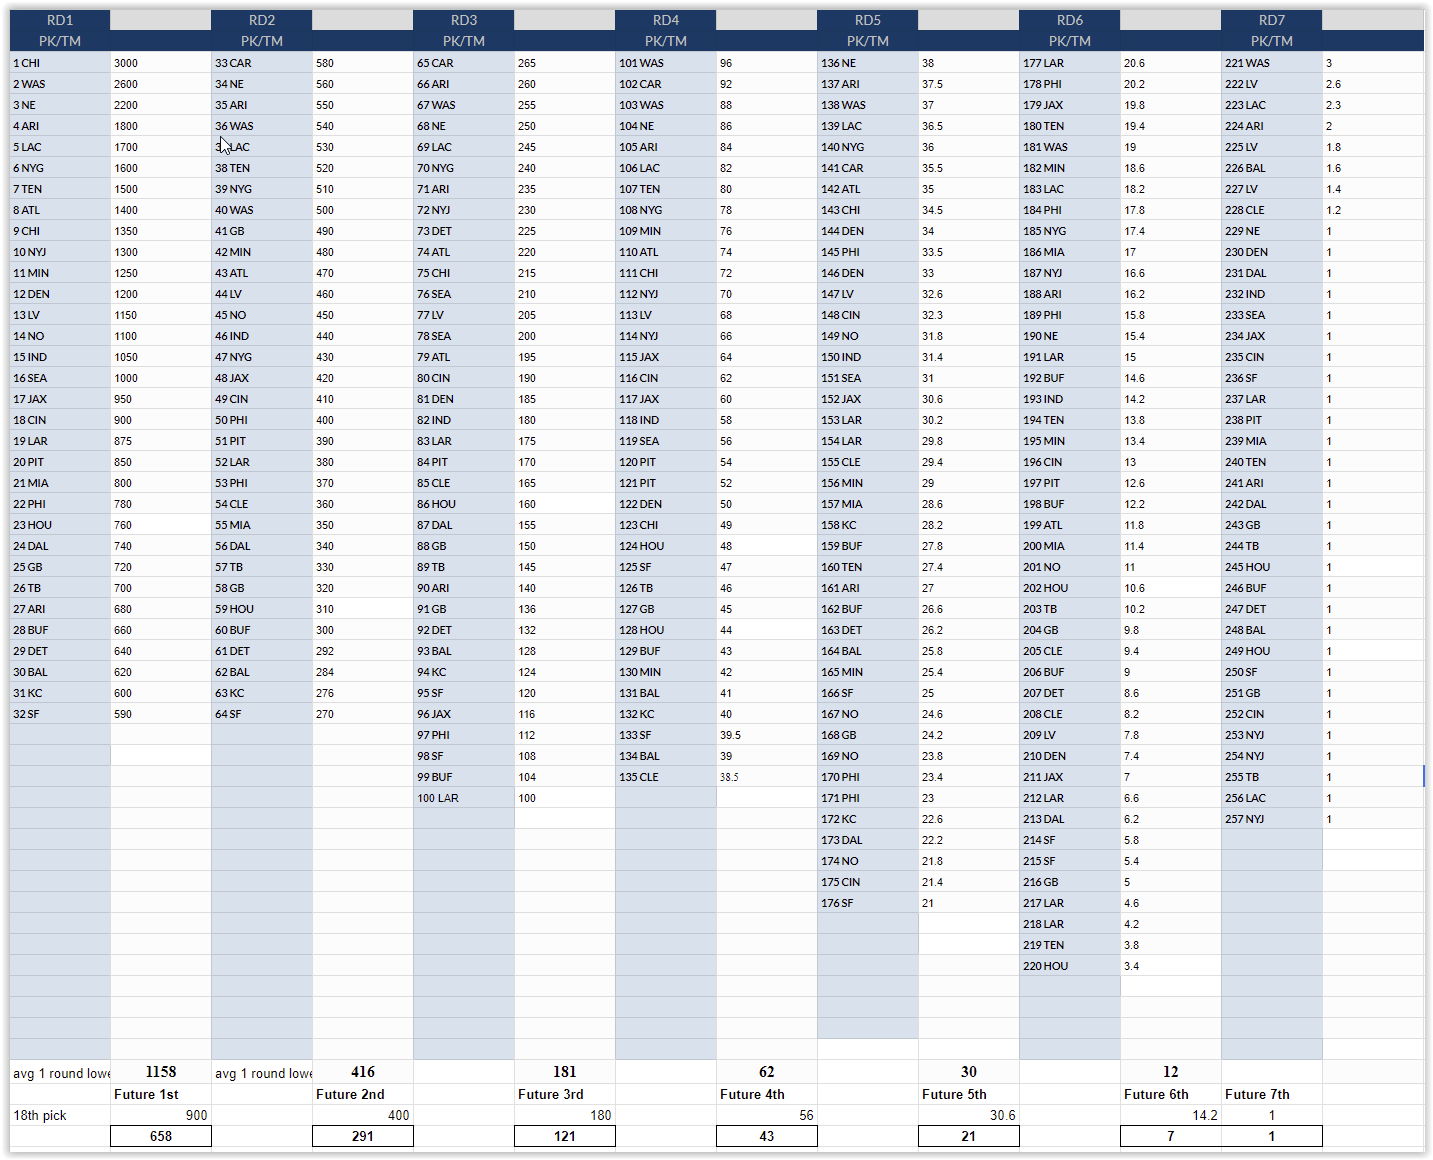
3X Hill Draft Trade Chart
Comparing the Johnson & 3X Hill Draft Trade Charts
The two biggest differences between the two charts are:
- The Johnson chart values the top 15 – 20 picks higher than the Hill chart.
- The Johnson chart values later picks lower than the Hill chart.
In summary, for the first 3 rounds, the Johnson chart will generally assign a higher value for the picks, while in the final 3 rounds, the Hill chart will generally assign a high value for the picks. However, the two charts are much more in line with each other once the Hill chart values are multiplied by 3.
The Average 3xHill-Johnson Draft Trade Chart
Staying with the KISS methodology, let’s go one step further and create a new draft trade chart by averaging out the Johnson & Hill values. You can see that chart below:
This NFL Draft Trade Chart smoothes out the rough edges between the Johnson & Hill charts. If one team were to prefer the Johnson chart and another team the Hill chart, this chart could be used to simplify any trade negotiations.
The Value of Future Draft Picks
One of the more nebulous values is the value of a future draft pick. After some research there seems to be two main schools of thought regarding the value of a future draft pick(trading a 2025 pick during the 2024 draft for example).
- The value of a future pick is the average value of a pick one round below.
Trading a 2025 1st round pick is worth the value of an average 2024 2nd round pick. Some would argue it is the value of the pick slot one round lower as opposed to the average.
For example, if Carolina were to trade it’s 2025 1st round pick, the value would be the value of the 33rd selection, the slot Carolina is picking in in 2024. However this is assuming that Carolina will finish as the worse team in 2024, which is not a foregone conclusion or even a statistical probability. Thus the average value of a 2nd round pick is probably the better choice for the value as it is less fraught with peril. - The value of a future pick is worth the value of the 18th pick of the round, the last non playoff team’s position.
For example, trading a 2025 1st round pick would be worth the value of the 18th pick in the 2024 draft. My guess is that this school’s values are negotiable when dealing with a very bad or very good team who’s pick does not project anywhere near the 18th pick. This method again leaves open the possibility, if not probability, that the future pick will not be worth what its calculated value is.
As a third option, why don’t we follow the same path that we did with the chart values, and calculate the value of the average of the One Round Less & 18th Pick values as well.
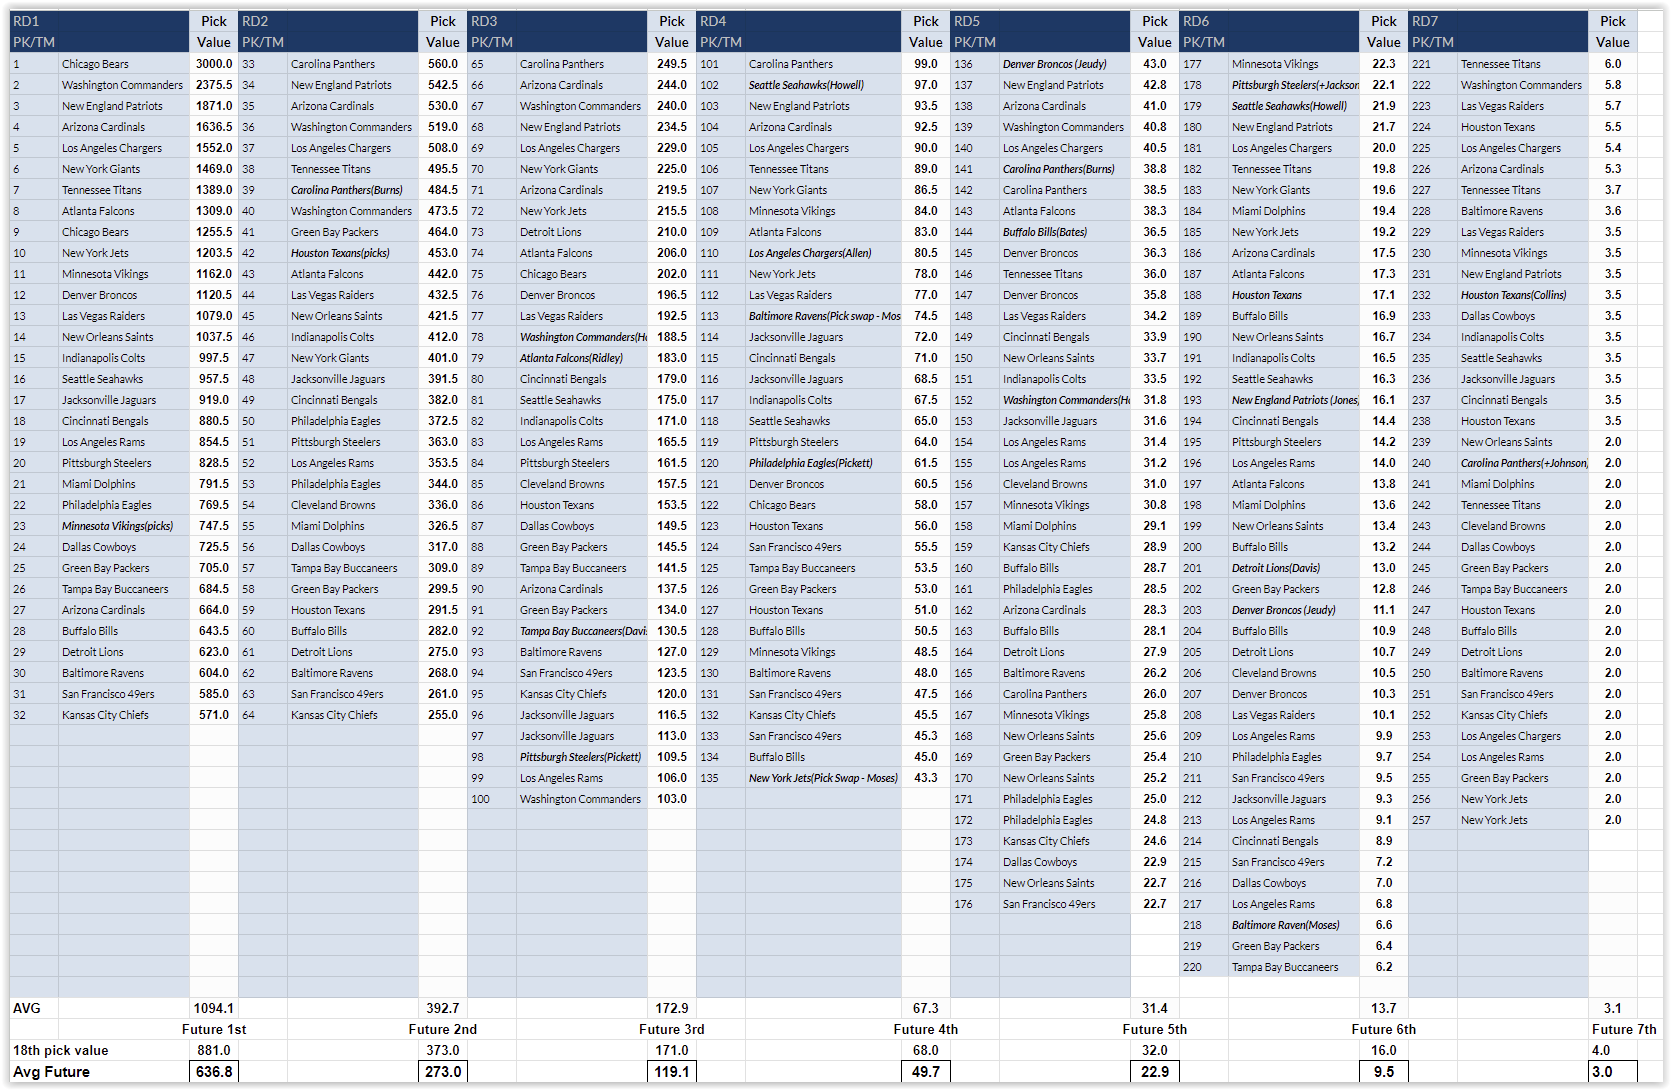
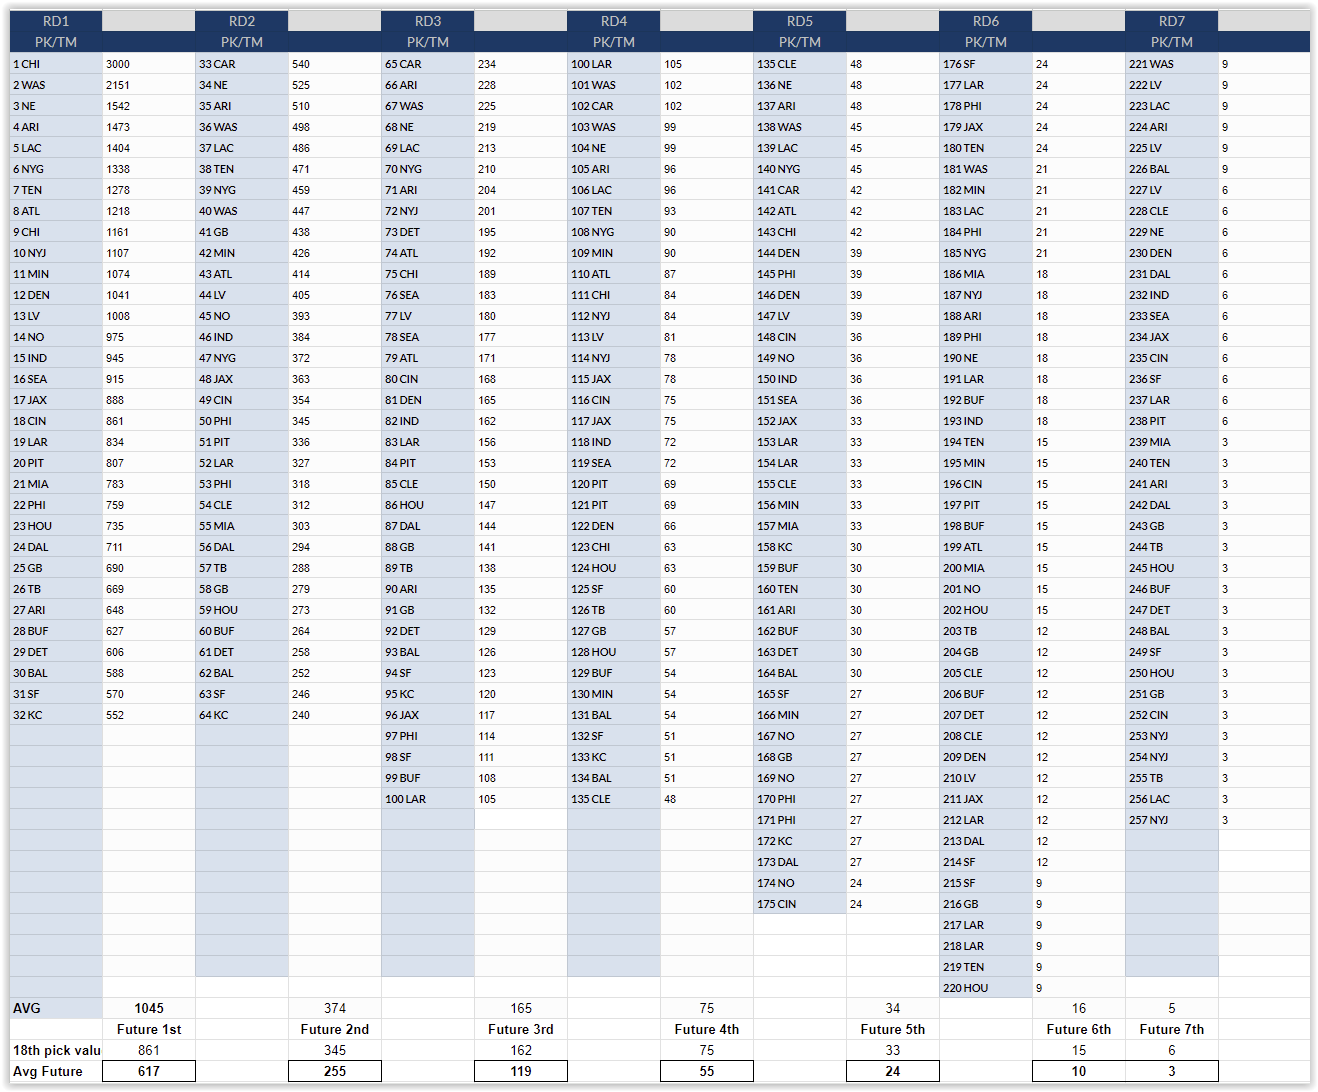
Johnson Draft Trade Chart & Future Pick Values
In the Johnson chart above you can see the average value of a pick in the round, the value of the 18th pick, and at the bottom in the boxes, the Average of the One Round Lower & 18th pick.
For example, if a team were trading a 2025 1st round pick:
- The average value of a round 2 pick is 416.
- The value of the 18th pick in the 1st round is 900.
- The average of those two value is 658
These are the three options of the 2025 1st round pick’s value. While the value of the 18th pick seems high, the average of a round lower is too low. However the average value of the two, 658, places the value at the bottom of round 1. By using this value, the future 1st round pick will be worth at least as much as every pick in the first round through pick 28. Only if the pick falls in slots 29-32 would the pick have been uundervalued.
In fact, by using the average of the One Round Lower Avg & the 18th Pick value, it always values a future pick as being worth around the 28th-29th pick in that round, regardless of round. This seems to be a very fair valuation of a future pick.
3X Hill Draft Trade Chart & Future Pick Values
In the 3X Hill chart we can see that the average of the One Round Lower & 18th Pick values for future round picks are the superior choice. Much like the Johnson chart, it sets the pick’s value as being equal to around the 28th or 29th pick of the round.
Average 3X Hill Johnson Draft Trade Chart Future Pick Values
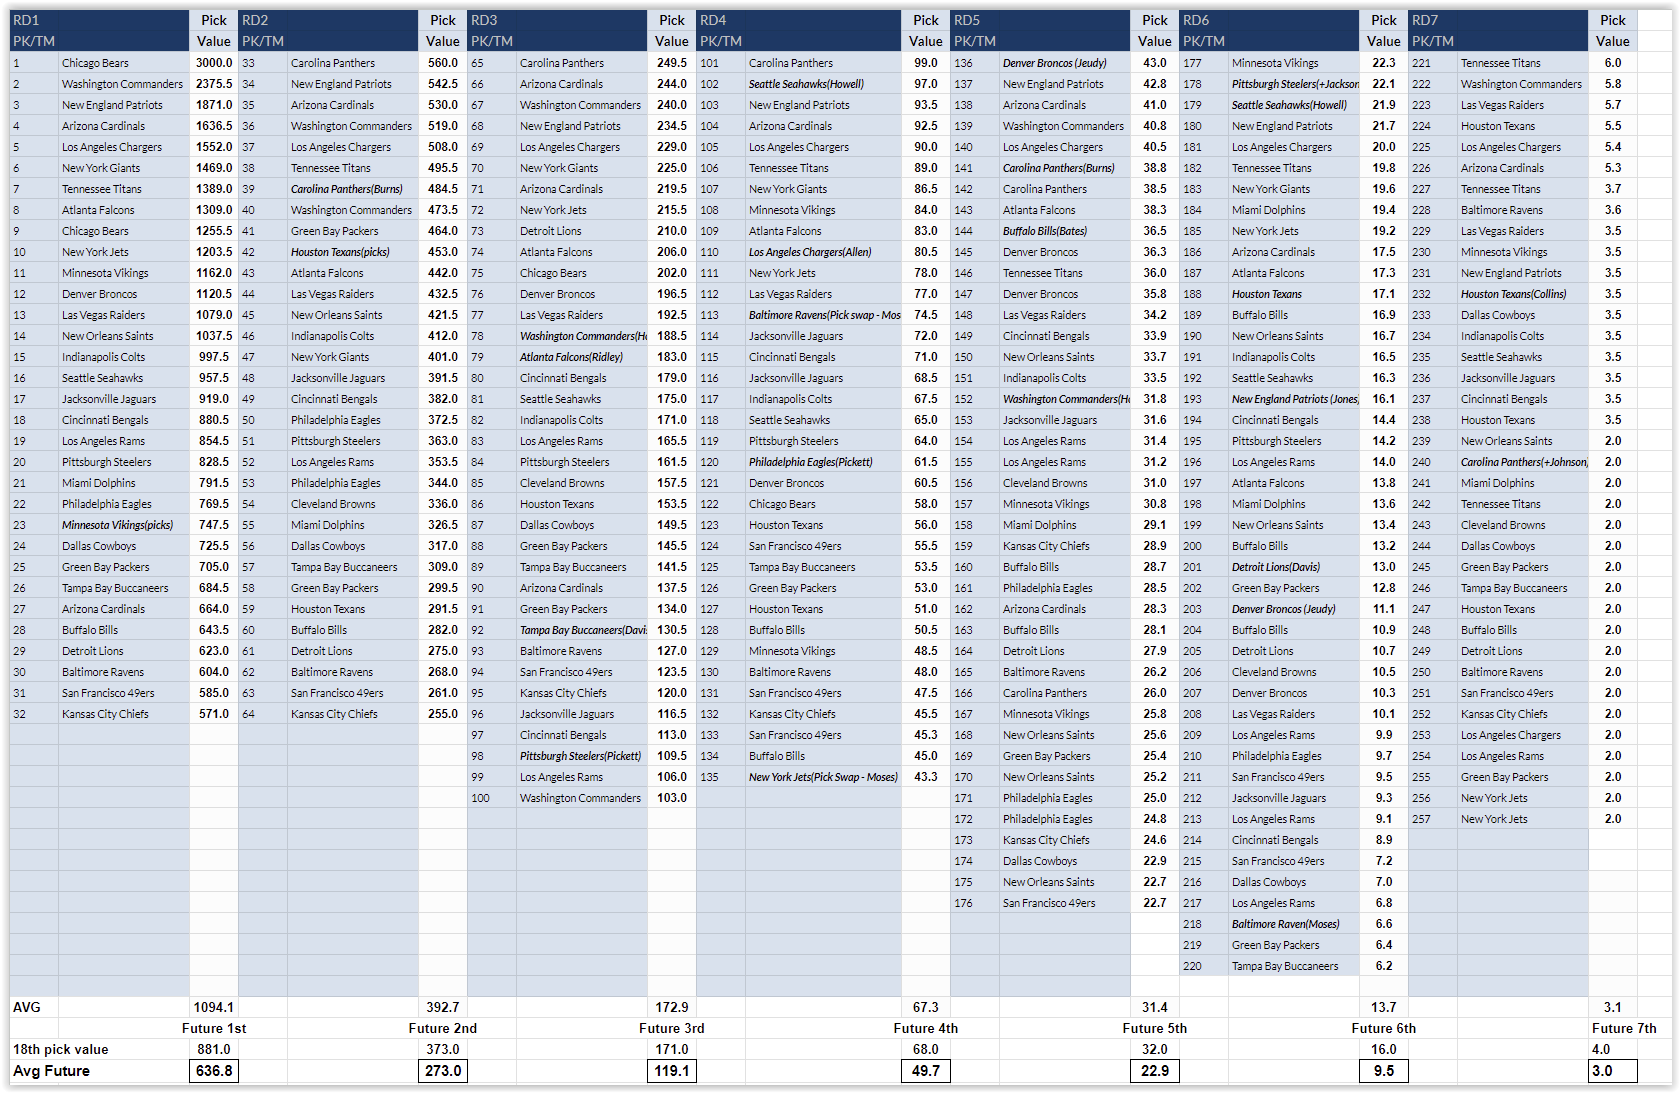
If you agreed that the Average 3X Hill Johnson Draft Trade Chart was a nice compromise, then here it is again with the value of future picks.
Again we see by using the average value of the 18th pick and the one round lower, the value of future draft picks is done in an equitable manner. A 2025 1st round pick would be worth 637 points, or about halfway between the value of the 28th & 29th pick. A 2025 4th round pick would be worth 50 points, the value between the 127th and 128th pick at the bottom of round 4.
In the next post we will test out the draft trade charts by evaluating this year’s trades and last years trade for the #1 pick. It will be a nice trade to study as it involved 2023 picks, future picks, and a player in DJ Moore. Perhaps the trade charts can tell us what value the teams placed on Moore based on the points missing from the traded pick’s values. It should also tell us whether this new draft trade chart we just made is any good.