NFL 2024 – The Demise Of The Philadelphia Eagles Defensive Line
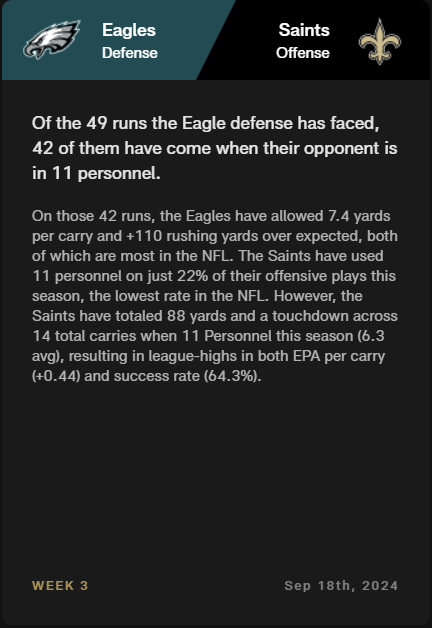
I was checking out pro.nfl.com stats and insights when this nugget about the Philadelphia Eagles defense caught my eye. The Eagles’ defense have faced 49 run plays, 42 of which came from 11 Formation. The Eagles are giving up 7.4 yards per carry on the 42 runs with +110 yards over expected.

The Eagles defensive line was once vaunted, and just a few years ago had 70 sacks, just 2 off the record by the ’84 Bears. What happened? Vic Fangio was supposed to come in and fix the defensive shortcomings. We saw the shortcomings against the pass and the lack of pressure against opposing quarterbacks. How can the Eagles be so bad against the run, and who’s fault is it? Is it Fangio’s system or the players simply not performing?
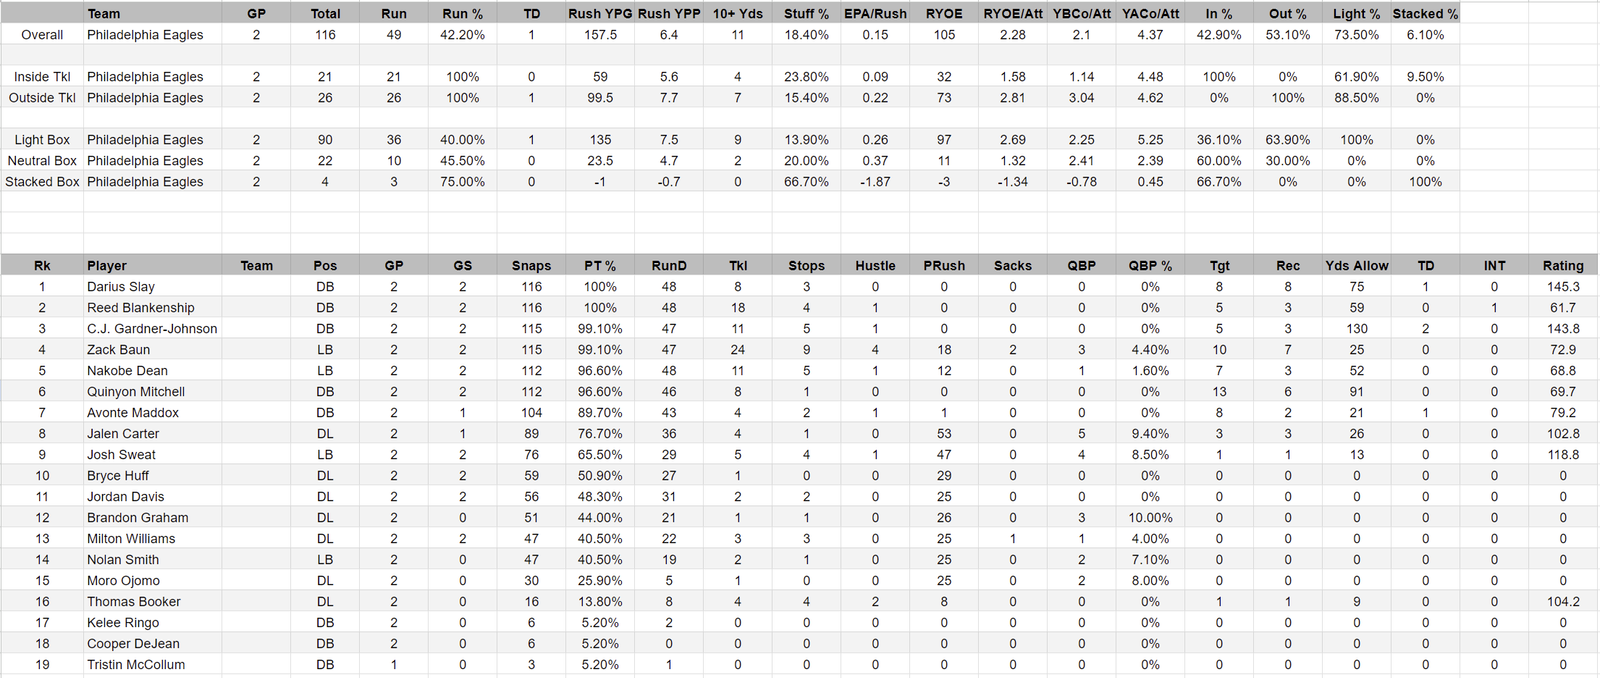
2024 Philadelphia Eagles Defensive Stats

In the chart above, the eagles defense against the run is broken down into the following subgroups:
- Overall
- Inside/Outside Tackle
- Light(6 man), Neutral(7 man), & Stacked (8+ man) Boxes
Below that you can see the individual player performances but set them aside for a moment because we will come back to them with their own chart.
For now here is a summary of the Eagles run defense:
- They have given up 315 yeards rushing
- They have faced 49 run plays out of 116 total plays for a run play faced pct. of 42.2%
- They give up 5.6 Yards per play (YPP) on inside tackle runs (21 times)
- They give up 7.7 YPP on outside tackle runs (26 times)
- They give up 7.5 YPP when using a light box (36 times)
- They give up 4.7 YPP when using a neutral box (10 times)
- They give up -0.7 YPP when using a stacked box (3 times)
- They have 9 stuffs for a stuff % of 18.4%
The reason the inside/outside only add up to 47 is that Cousins kneeled down twice at the end of the game. NFL must not count these as inside(or outside) runs. I am guessing that the Eagles were then credited with 2 Stuffs. In any case, if you removed the Cousins kneel downs the Eagles are giving up 6.7 YPP vs the rush, as opposed to 6.4 YPP you see in the chart.
Average Positive Rush Gain (APRG)
By definition a Stuff is a running play which accounts for no gain or a loss. There aren’t exact stuff yardage stats, so let’s just assume they all were for no gain(if we assume some negative value we will be making their run defense look even worse than it may be, so let’s err on the side of generousity). Thus APRG = Rushing Yards Allowed / (Running plays faced – Stuffs).
That means they faced 40 rushes(49 – 9 stuffs) which gained yards. 315 / 40 = 7.875 YPP(this is the APRG). So if the Eagles don’t stuff a run, it goes for an AVERAGE of almost 8 yards.
The inside outside tackle breakdown is almost 50/50 (inside 44.7% outside 55.3%). They faced a run with a light box 73.5%, a neutral box 20.4%, and used a stacked box 6.1%(most likely short yardage).
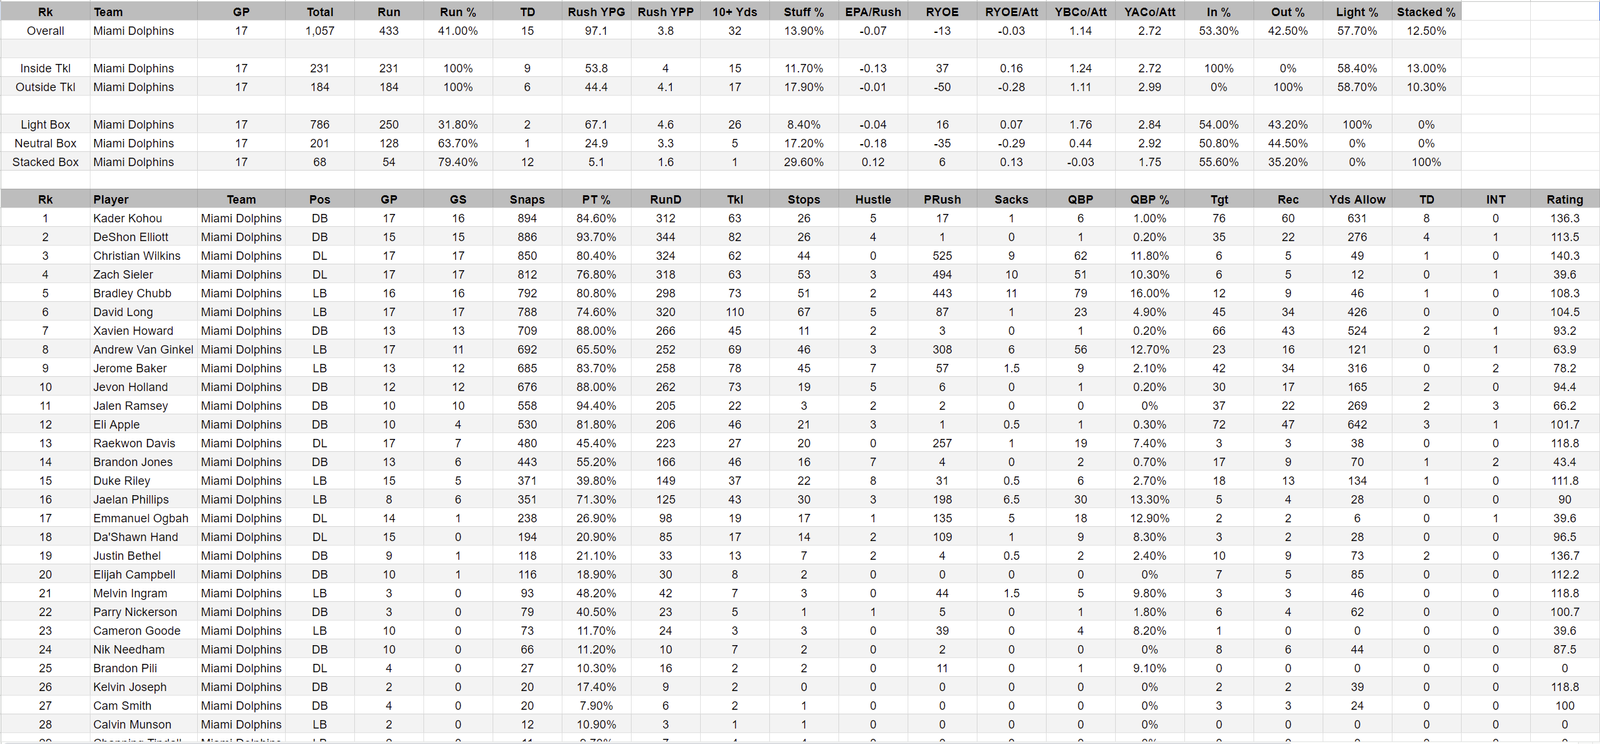
Now let’s take a look at the 2023 Miami Dolphins defense, Fangio’s last stop before Philadelphia. Below you will see the exact same chart used for the 2024 Eagles Defense, but this is for 2023 Miami Dolphins defense that Fangio ran.
2023 Miami Dolphins Defensive Stats

Overall Miami gave up 3.8 YPP against the run in 2023 with Fangio. Here are some of the same splits:
- They faced 433 run plays for a run faced % of 41%, and gave up 1651 yards
- They gave up 97.1 yards rushing per game (Eagles 157.5)
- They gave up 4 Yards per play (YPP) on inside tackle runs (231 times)
- They gave up 4.1 YPP on outside tackle runs (184 times)
- They gave up 4.6 YPP when using a light box (250 times)
- They gave up 3.3 YPP when using a neutral box (128 times)
- They gave up 1.6 YPP when using a stacked box (54 times)
- They had a stuff % of 13.9%, which results in a total of 60 stuffs.
Average Positive Rush Gain
Let’s do the Stuff math first. APRG = 433 – 60 stuffs = 373 positive run gains. 1651 / 373 = 4.43 YPP average positive run gains (Eagles 7.875).
Again the Inside/Outside split is close to 50/50, but with inside runs(55.6%) havving the majority in the Dolphins case.
The Dolphins faced the run with a light box (57.9%), neutral box (29.6%), & a stacked box (12.5%). So the Eagles have been caught in a light box far more often so far in 2024 (73.5%) & used the stacked box half as much (6.1%). The stacked box stat is more situational(how often a defense is in short yardage situations), but getting caught in a light box 73.5% of the time is not situational. This may be a fault we can lay at Fangio’s feet so far in 2024, but the majority of the blame should go elsewhere.
2024 Philadelphia Eagles Defensive Player Stats

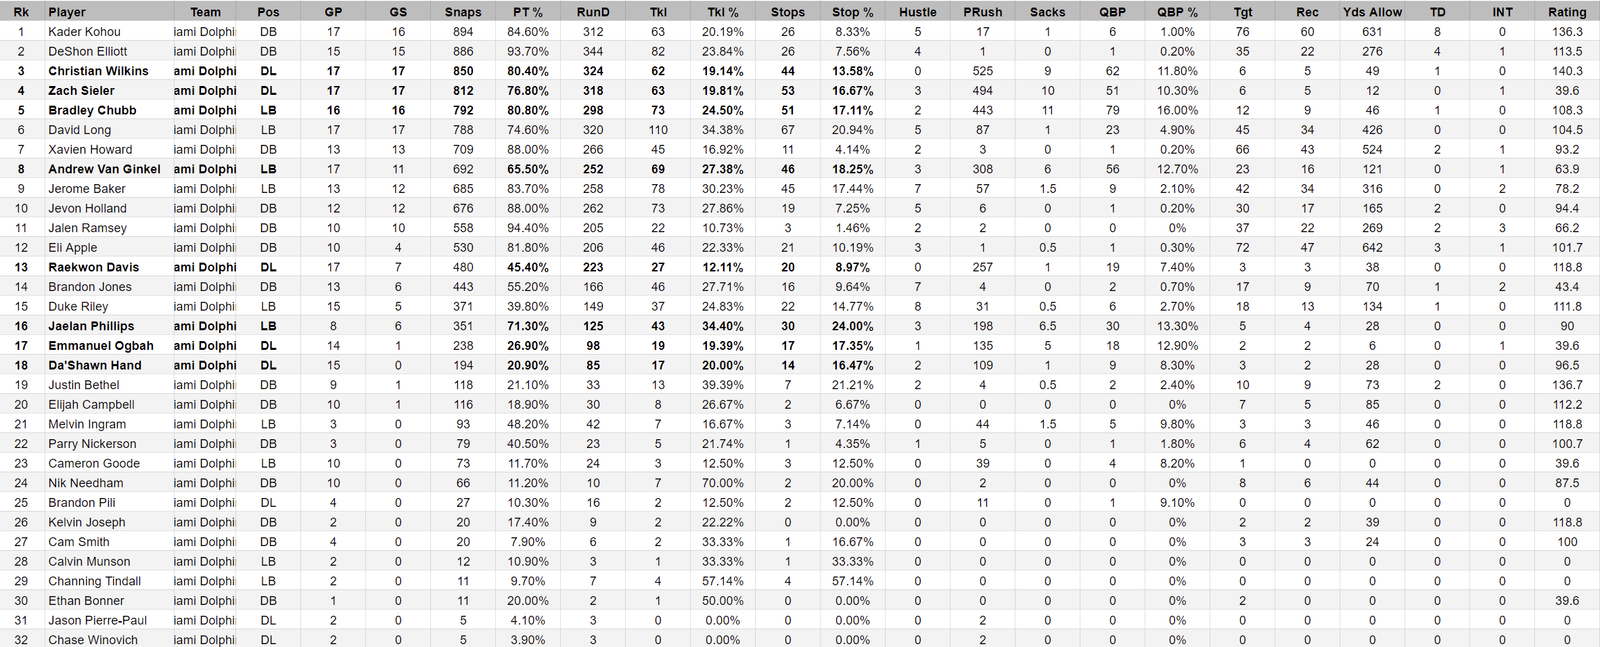
2023 Miami Dolphins Defensive Player Stats

2024 Eagles Defensive Players
In the two player charts above, the DL and Edge players are in BOLD type. Quite frankly you don’t need blod type to see the stark difference in defensive line play between the 2024 Eagles & 2023 Dolphins.
The average 2023 defensive lineman from the Dolphins would make a tackle on about 20% of the run snaps they faced. Raekwon Davis is low (12.11%), Chubb & Van Ginkel are high, but I think 20% is a fair estimate to use.
The average 2024 Eagles defensive lineman is probably at 10%, and that may be being kind. Ojomo & Booker have high % but have played almost no snaps. Bryce Huff 3%, Brandon Graham 5%, Jordan Davis 6%, Nolan Smith 10%, Jalen Carter 11%…
Josh Sweat17% and Milton Willams at 13% have been the only reliable run stoppers on the Eagles defensive line. To be quite honest, 13% & 17% are not great values, so it would be fair to say those two have been average against the run.
Baun has 24 tackles against the run. The entire DT/DE/Edge squad that is bolded has 23. Blankenship 18, Dean 11, Gardner-Johnson 11, Slay 8, Mitchell 8, Maddox 4. That means eactly one Eagles defensive lineman has more tackles against the run than Maddox, and that is Josh Sweat with 5.
Slay hasn’t broken up a pass all year, or even forced an incompletion. Opposing QBs are 8 for 8 for 75 yards and 1 TD against him for a rating of 145.3. Gardner Johnson has been targeted 5 times, gave up 3 completions for 130 yards and 2 TD for a rating against him of 143.8.
2024 Eagles Defensive Stats
- 21st in QB pressure % (29.4%)
- 17th in Time To Pressure (2.67)
- 11th in Blitz % (27.9%)
- 13th in opposing time to throw (2.85)
- 29th in sacks with only 3 (Baun has 2, M. Williams 1)
So they are not stopping the run, they get average pressure, and they rarely get sacks. In fact the entire DL has a grand total of 1 sack.
2023 Dolphins Defensive Stats
- 3rd in QB Pressure %, (40.7%)
- 20th Time to Pressure (2.66)
- 23rd in Blitz % at (21.4%)
- 25th in Time to Throw (2.73)
- 3rd in sacks with 56
Who’s Fault Is It?
So Fangio is blitzing slightly more with the Eagles (27.9% vs 21.4%), the time to pressure is almost identical, but opposing QBs have more time to throw, feeling less pressure, and are avoiding sacks. This would appear as if Fangio is adjusting his blitz % to help the Eagles get more pressure, but that isn’t working.
This speaks to either a lack of talent or effort by the Eagles defensive linemen. Fangio’s Dolphins faced very similar play types and percentages, but the 2023 Dolphin defensive linemen have massively outperformed when compared to the 2024 Eagles D-line thus far.
Bryce Huff could literally stand still and his run tackle % would be higher than 3% just from opposing RBs occassionally running into him(assuming they don’t run him over and keep on going). Brandon Graham is a legendary Eagle, but he is a one trick pony now. How can Jordan Davis be so big and do so little? If you want to make an argument that he is occupying blockers and being constantly double and triple teamed, fine. But that would just make every other DL that much worse.
In the end, this is on the defensive line, their coaches and the front office. The players are going to have to improve, both in technique and effort. The coaches are going to have to scheme around the run defense inadequacies. The front office needs to be raiding some practice squads. Ceratinly Fangio needs to adjust as well, but this appears to be player underperformance more than scheme or play calling.

