NFL 2024 – DB & LB Pass Coverage Ratings & Rankings


PDF Format – NFL 2024 – DB LB Pass Coverage Ratings & Rankings
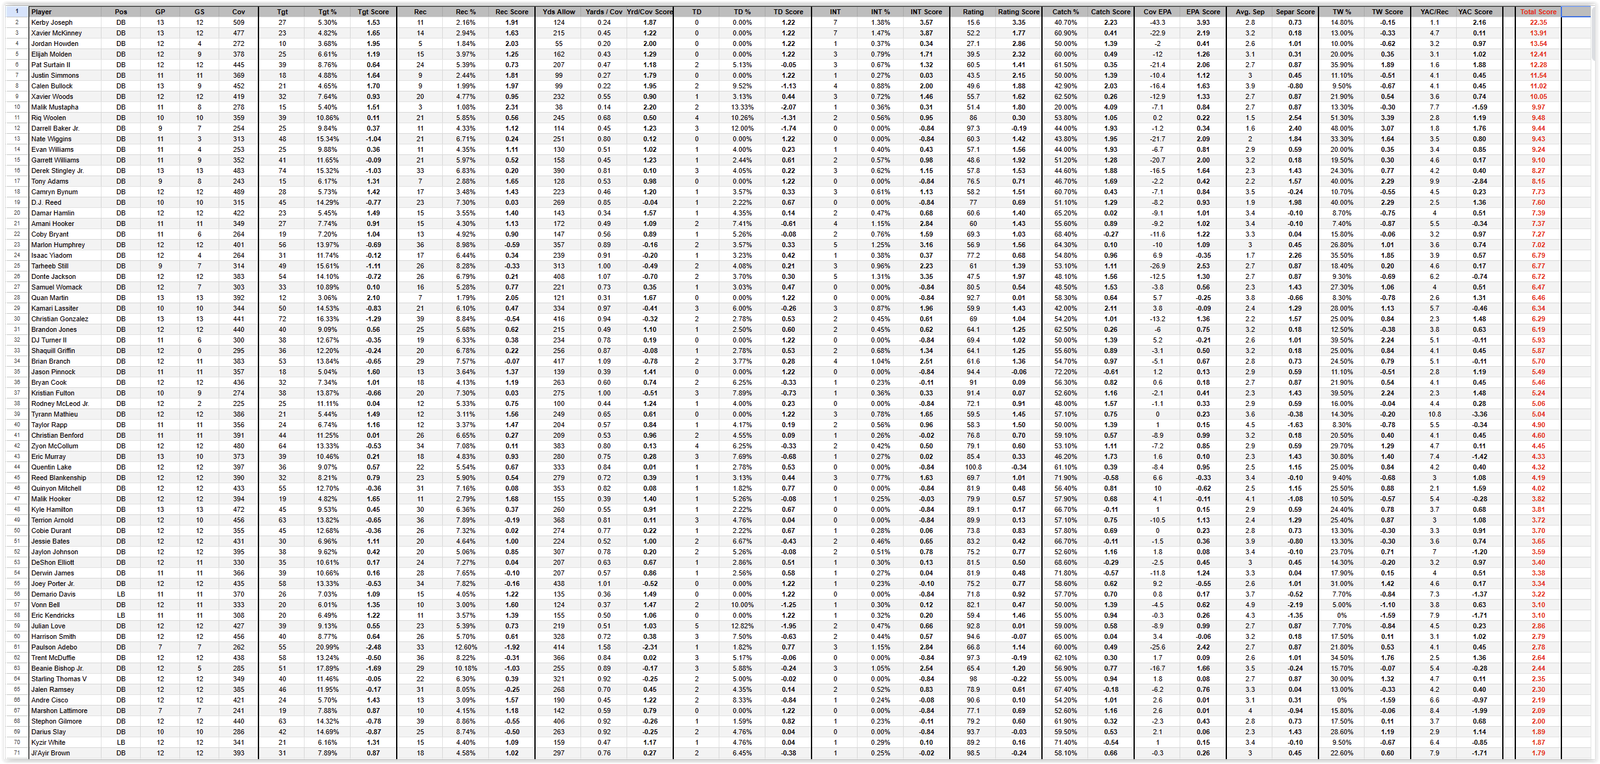
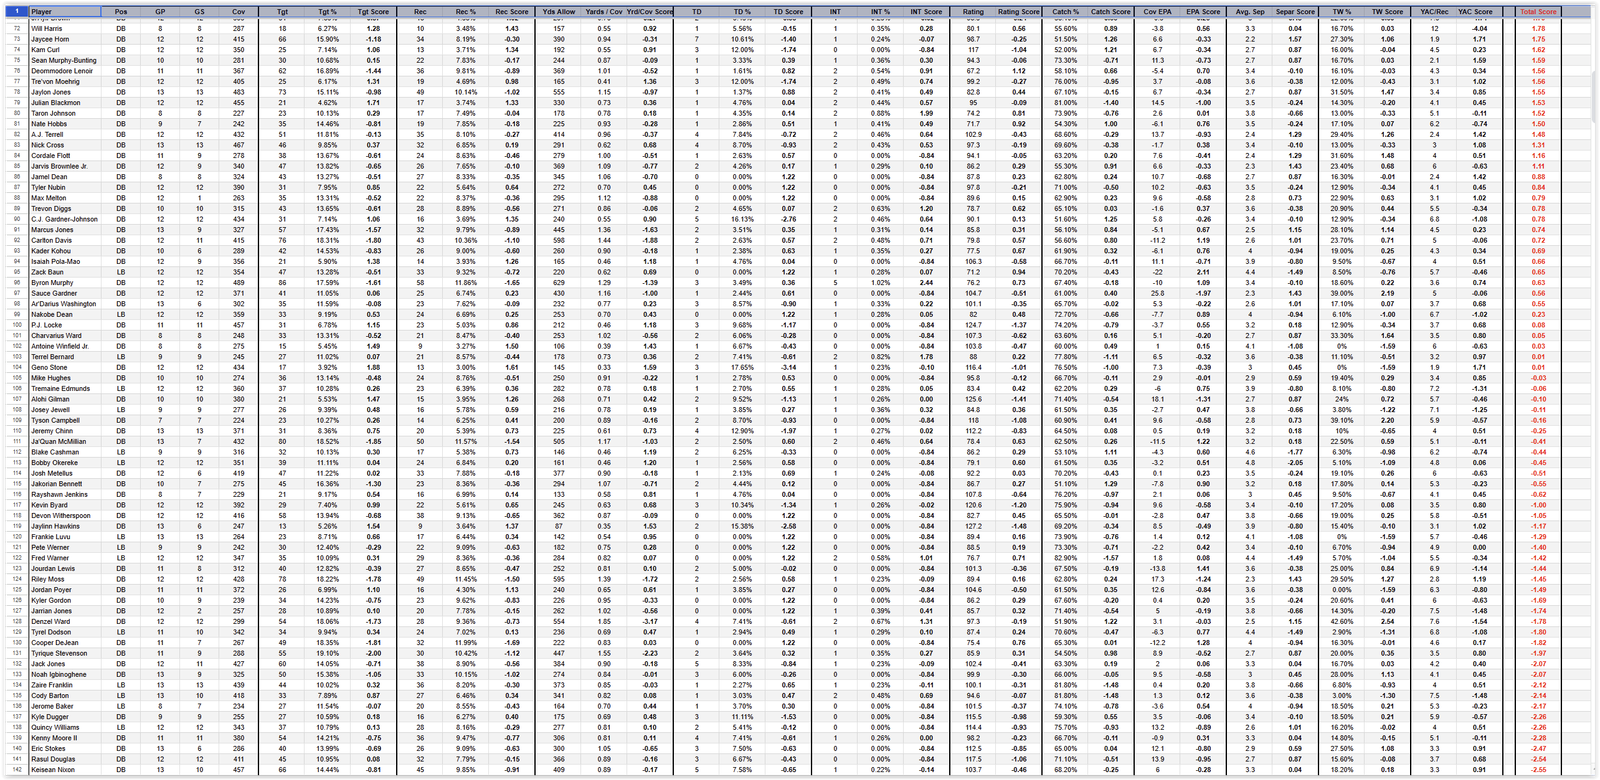
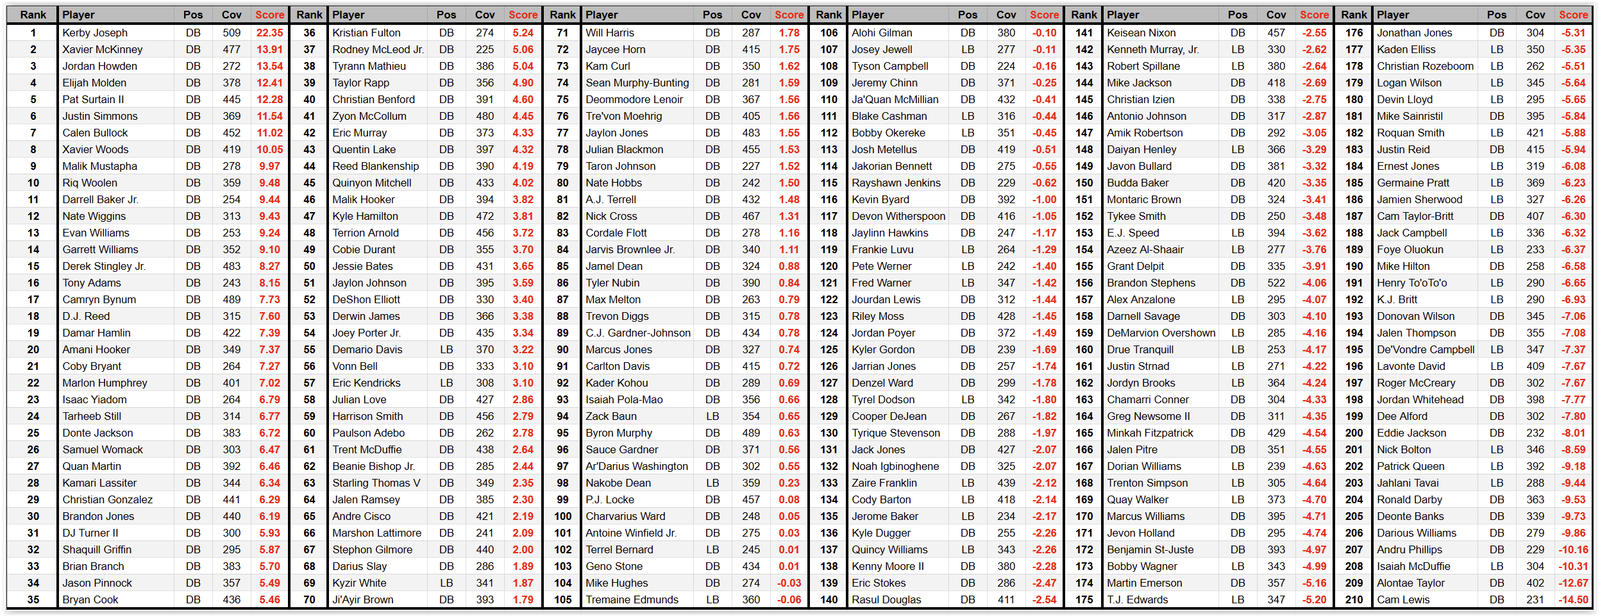
Here are the top 210 Defensive Backs & Linebackers in terms of times they dropped into coverage. Next Gen Stats designates Cornerbacks and Safeties as DBs. This ends up being an average of 6 – 7 per team, or basically the starting coverage unit.
The cut off was about 225 coverage dropbacks. Thus the players on this list average about 20 – 40 coverage dropback per game.
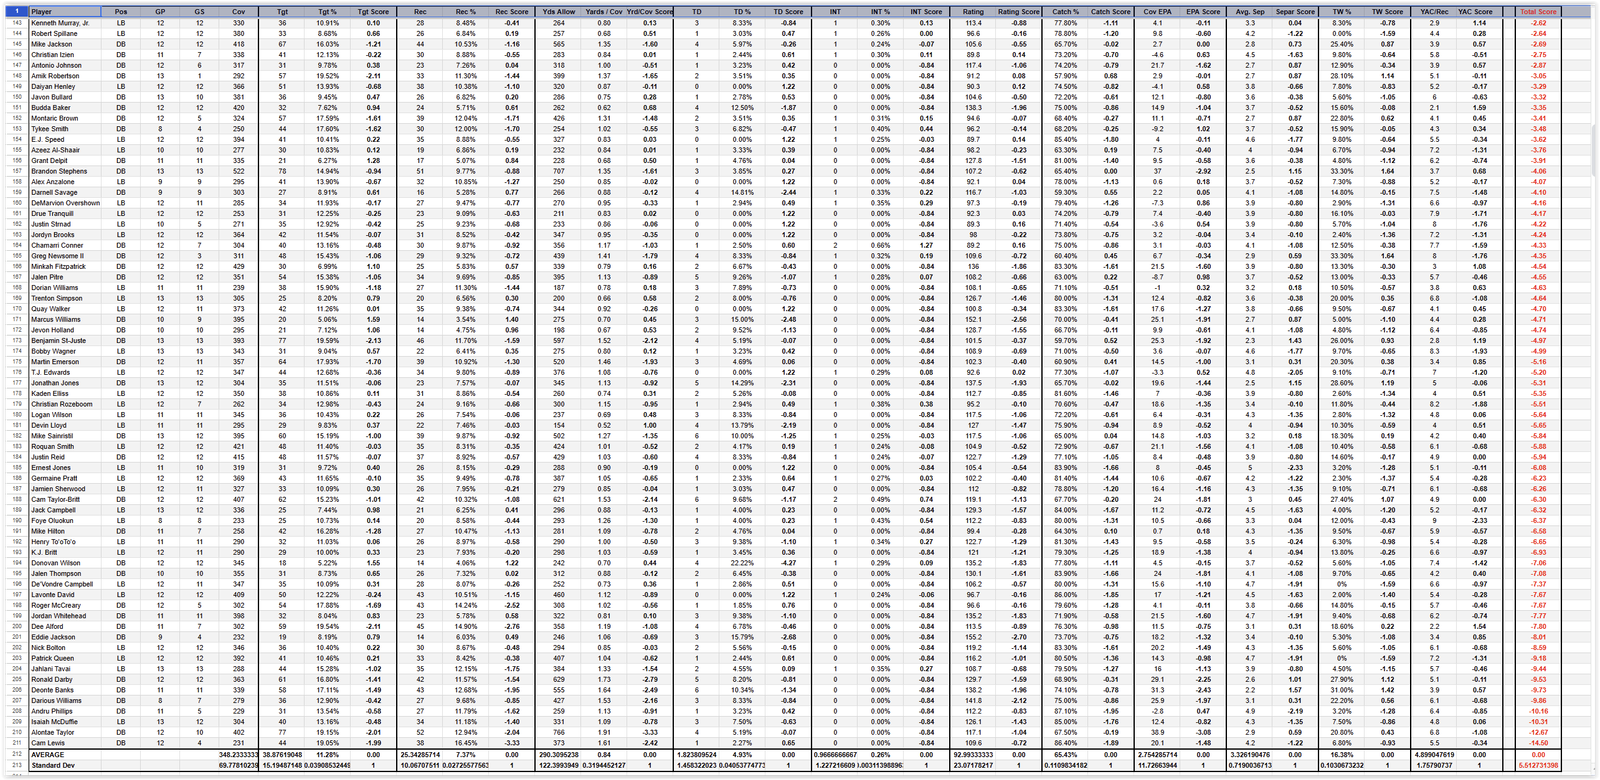
The scoring was done using comparative standard deviation. Thus all 210 players are ranked and scored against each other in each metric, the score being their standardized value. The values come from Next Gen Stats Closest Defender split.
Scoring
If you want to read an explanation about standard deviation scoring, you can read about it in the QB Score post.
Very simply, the average score for SD scoring in a metric or overall is 0.00. Thus positive scores are good, negative scores are bad. Individual metric scores typically range from -3 to +3, but there can be outliers in some metrics.
As a score gets more positive or more negative, it shows how good, or how bad, the player is compared to all other players in that metric or overall. You can see the average and the size of one SD unit at the bottom of each column.
For this exercise, since there are 11 scoring metrics, I will break down the tiers in the following manner:
+11.00 + Superior (averages over +1 SD unit vs peers in all metrics)
+5.51 thru +10.99 Excellent (averages +0.5 thru +1.0 SD units)
0.00 thru +5.50 Good (averages 0.00 thru +0.5 SD units)
-5.50 thru 0.00 Mediocre (averages -0.5 thru 0.00 SD units)
-10.99 thru -5.51 Poor (averages -1.0 thru -0.5 SD units)
-11.00 & below Dismal (averages under -1.0 SD units)
- Kerby Joseph is off the chart. His score of +22 means he averages not +1, but +2 SD units per metric. Opposing QB Passer Rating with him as the nearest defender is 15. That is the rating of Tim Boyle’s red-headed stepchild. This is the annoying kid who got 800/800 on the SAT. The next highest overall score is +13 by Xavier McKinney who I think we would all agree is having a great season. That being said, I am not sure what superlative suffices for Joseph’s season so far. Kerbulous? Kerbpendous?
- Joining Joseph and McKinney in the 11+ group are Howden, Molden, Surtain, Simmons & Bullock.
- Only two players scored -11 or worse: Cam Lewis & Alontae Taylor. Andru Phillips and Isaiah McDuffie scored -10.
DB & LB Ratings & Rankings Notes
While Next Gen classifies CBs & Safeties as DBs(no distinction between them), the only splits for coverage is closest defender. There could be some potentials issues with this because of the split and where defenders line up.
There is no split for zone vs man, so now we have the biggest issue that could cloud our data and scoring:
- A CB can be in man or zone coverage. In man, they should be the closest defender with the exception of a double team or late help. If they are not the closest defender, they got beat badly which is ok, as that will probably be reflected in the metrics it effects. In zone, they man or may not be the closest defender at different times during the play. I’ll go into this further below.
- A Safety is normally not put into man coverage, or let’s say is not put into man coverage nearly as much as a CB. Thus a majority of the time, a safety will be in zone, or transitioning from zone to man as they break to cover the intended receiver.
- Many of the metrics will be influenced by whether a defender is in zone or man. Separation, tight window, yac/rec, catch%…in fact every single metric can, and is, influence by the type of coverage.A defender playing zone may be closest defender by 5-6 yards, while in man, getting beat by 5-6 yards is a pending disaster. How much YAC a receiver can gain is going to be influenced by how far they are from the closest defender once they have secured the catch and can make a “football move”(which has to be both the most nebulous, and dumbest term, you could use in a term used in a critical reception qualification. You could say the receiver must “do something” and that is about as descriptive and helpful as a “football move” is when helping to decide whether a ball was caught and fumbled or just dropped).
- If you think that is confusing, try to apply all of that to Linebackers as well.
- In the end my guess is it may favor safeties a bit. If you think about all the metrics and run through scenarios in your head for each position, safeties may get a small break in some of the yardage based metrics, the interceptions(since they are playing more of a center field for bad throws and tips), and several other metrics. This is more a gut feeling than anything I can pinpoint statistically so it could also be entirely wrong.
The point is, this is a ratings and ranking system that has some issues and may not be entirely fair to every player. Depending on how often they are asked to play man or zone, whether they are often ahead and playing a desperate QB, or often behind and getting torched on merit, none of this is really factored in.
That being said, outside of the fact that I picked the metrics(which were kind of forced via Next Gen), this rating and ranking system is entirely objective and based on performance. It also is comparative, so we are measuring these 210 players against each other so you can see where every player gained or loss points vs the field.
With those caveats mentioned, I hope you enjoy reading through the data, scoring, and arguing over how big an idiot the guy who created the system is. Enjoy the games this week!
The Coverage Metrics
- Target %
- Reception %
- Yards / Cover
- TD % Against
- Interception %
- Passer Rating Against
- Catch %
- Cover EPA
- Average Separation
- Tight Window %
- YAC/Reception

Best & Worst Cover Defensive Backs & Linebackers
The best and worst at each pass coverage metric. Average for the metric is in parenthesis.
Top 10
- Kerby Joseph
- Xavier McKinney
- Jordan Howden
- Elijah Molden
- Pat Surtain II
- Justin Simmons
- Calen Bullock
- Xavier Woods
- Malik Mustapha
- Riq Woolen
Bottom 10 (#1 is the worst)
- Cam Lewis
- Alontae Taylor
- Isaiah McDuffie
- Andru Phillips
- Darious Williams
- Deonte Banks
- Ronald Darby
- Jahlani Tavai
- Patrick Queen
- Nick Bolton
Most Times In Coverage (348)
- Brandon Stephens 522
- Kerby Joseph 509
- Camryn Bynum 489
- Byron Murphy 489
- Derek Stingley Jr. 483
- Jaylon Jones 483
Most Targeted (39)
- Byron Murphy 86
- Ja’Quan McMillian 80
- Brandon Stephens 78
- Riley Moss 78
- Alontae Taylor 77
- Benjamin St-Juste 77
Highest Target % (11.28%)
- Paulson Adebo 20.99%
- Benjamin St-Juste 19.59%
- Dee Alford 19.54%
- Amik Robertson 19.52%
- Alontae Taylor 19.15%
- Tyrique Stevenson 19.10%
Lowest Target % (11.28%)
- Quan Martin 3.06%
- Jordan Howden 3.68%
- Geno Stone 3.92%
- Julian Blackmon 4.62%
- Calen Bullock 4.65%
- Xavier McKinney 4.82%
- Malik Hooker 4.82%
Most Receptions Allowed (25)
- Byron Murphy 58
- Alontae Taylor 52
- Brandon Stephens 51
- Ja’Quan McMillian 50
- Jaylon Jones 49
- Riley Moss 49
Least Receptions Allowed (25)
- Malik Mustapha 3
- Jordan Howden 5
- Quan Martin 7
- Tony Adams 7
- Calen Bullock 9
- Justin Simmons 9
- Jaylinn Hawkins 9
- Antoine Winfield Jr. 9
Highest Reception % (7.37%)
- Cam Lewis 16.45%
- Dee Alford 14.90%
- Roger McCreary 14.24%
- Alontae Taylor 12.94%
- Deonte Banks 12.68%
- Paulson Adebo 12.60%
Lowest Reception % (7.37%)
- Malik Mustapha 1.08%
- Quan Martin 1.79%
- Jordan Howden 1.84%
- Calen Bullock 1.99%
- Kerby Joseph 2.16%
- Justin Simmons 2.44%
Highest Yards / Coverage (0.84)
- Alontae Taylor 1.91
- Denzel Ward 1.85
- Ronald Darby 1.73
- Deonte Banks 1.64
- Cam Lewis 1.61
- Paulson Adebo 1.58
Lowest Yards / Coverage (0.84)
- Malik Mustapha 0.14
- Jordan Howden 0.20
- Calen Bullock 0.22
- Kerby Joseph 0.24
- Justin Simmons 0.27
- Quan Martin 0.31
Highest TD % (4.93%)
- Donovan Wilson 22.22%
- Geno Stone 17.65%
- C.J. Gardner-Johnson 16.13%
- Eddie Jackson 15.79%
- Jaylinn Hawkins 15.38%
- Marcus Williams 15.00%
Lowest TD % (4.93%)
37 players tied at 0%
Lowest INT % (0.26%)
93 players tied at 0%
Highest INT % (0.26%)
- Xavier McKinney 1.47%
- Kerby Joseph 1.38%
- Donte Jackson 1.31%
- Marlon Humphrey 1.25%
- Amani Hooker 1.15%
- Paulson Adebo 1.15%
Highest Passer Rating Against (92.99)
- Eddie Jackson 155.2
- Marcus Williams 152.1
- Darious Williams 141.8
- Budda Baker 138.3
- Deonte Banks 138.2
- Jonathan Jones 137.5
Lowest Passer Rating Against (92.99)
- Kerby Joseph 15.6
- Jordan Howden 27.1
- Elijah Molden 39.5
- Justin Simmons 43.5
- Donte Jackson 47.5
- Garrett Williams 48.6
Highest Catch % Against (65.43%)
- Andru Phillips 87.1%
- Cam Lewis 86.4%
- Lavonte David 86.0%
- E.J. Speed 85.4%
- Isaiah McDuffie 85.0%
- Jack Campbell 84.0%
Lowest Catch % Against (65.43%)
- Malik Mustapha 20.0%
- Kerby Joseph 40.7%
- Kamari Lassiter 42.0%
- Calen Bullock 42.9%
- Nate Wiggins 43.8%
- Evan Williams 44.0%
- Darrell Baker Jr. 44.0%
Highest EPA Against (2.75)
- Alontae Taylor 38.9
- Brandon Stephens 37.0
- Deonte Banks 31.3
- Ronald Darby 29.1
- Darious Williams 25.9
- Sauce Gardner 25.9
Lowest EPA Against (2.75)
- Kerby Joseph -43.3
- Tarheeb Still -26.9
- Paulson Adebo -25.6
- Xavier McKinney -22.9
- Zack Baun -22
- Nate Wiggins -21.7
Highest Average Separation (3.33)
- Ernest Jones 5.0
- Vonn Bell 4.9
- Andru Phillips 4.9
- T.J. Edwards 4.8
- Bobby Okereke 4.7
- Patrick Queen 4.7
- De’Vondre Campbell 4.7
- Jordan Whitehead 4.7
Lowest Average Separation (3.33)
- Riq Woolen 1.5
- Darrell Baker Jr. 1.6
- Isaac Yiadom 1.7
- D.J. Reed 1.9
- Nate Wiggins 2.0
- Christian Gonzalez 2.2
- Tony Adams 2.2
- Jaycee Horn 2.2
- Deonte Banks 2.2
Lowest Tight Window Against (16.38%)
- Geno Stone 0%
- Andre Cisco 0%
- Jordan Poyer 0%
- Antoine Winfield Jr. 0%
- Frankie Luvu 0%
- Robert Spillane 0%
- Eric Kendricks 0%
- Patrick Queen 0%
- De’Vondre Campbell 0%
Highest Tight Window Against (16.38%)
- Riq Woolen 51.3%
- Darrell Baker Jr. 48%
- Denzel Ward 42.6%
- D.J. Reed 40.0%
- Tony Adams 40.0%
- Kristian Fulton 39.5%
- DJ Turner II 39.5%
Highest YAC/Rec Against (4.90)
- Will Harris 12.0
- Tyrann Mathieu 10.8
- Tony Adams 9.9
- Foye Oluokun 9.0
- Marshon Lattimore 8.4
- Bobby Wagner 8.3
Lowest YAC/Rec Against (4.90)
- Kerby Joseph 1.1
- Pat Surtain II 1.6
- Darrell Baker Jr. 1.8
- Jaycee Horn 1.9
- Geno Stone 1.9
- Quinyon Mitchell 2.1
- Sean Murphy-Bunting 2.1
- Budda Baker 2.1

